Digital Design of Smart Images
A Design Story
Brian Drayton and Gillian Puttick
TERC, Cambridge, Mass., U.S.A.
Abstract
i
This paper describes a sequence of design decisions made while transforming a high-school capstone course from print to electronic form. Because complex images used as data for student investigations were central to the curriculum, the project sought to make use of affordances of the digital environment to scaffold students' interpretation of these data. Several technical strategies were prototyped, and their strengths and weaknesses explored in teaching experiments in which students were asked to use the tools to solve problems from the curriculum, and talk about their process. Our work with visuals as data for inquiry suggests that the 'syntax' of practice, and the 'substance' of core disciplinary ideas, are not sufficient for students to fully engage with images that constitute complex data requiring interpretation. In addition, a considerable amount of information about phenomena and settings is necessary, with the substance constituting the semantics of the problem space. Thus, we came to see that our scaffolding model was not adequate to the aims of the curriculum we were designing.
Introduction
ii
This paper describes a sequence of design decisions made while transforming a high-school capstone course from print to electronic form. Biocomplexity is a course that engages students in the recent science of ‘coupled natural and human’ (CNH) systems, exploring the complex fabric of relationships between humans and the environment at all spatial and temporal scales. Images designed to be used as data are an important component of the curriculum. Because complex images present a difficult interpretation challenge for students, we focused on disciplinary strategies used by experts when they interpret complex images. We drew on these as we designed supports for students to engage with and inquire into such images effectively. We also conducted a series of teaching experiments with a focus group of high school students to examine the usefulness of the supports we designed.
In these teaching experiments, we found that processes of decoding and analyzing the formal structure of visual data were quickly superseded by processes of interpretation that required domain knowledge. Indeed, the very process of decoding the complex images required the use of interpretive categories or concepts, which implied a level of knowledge of concepts, phenomena, and practices that went well beyond the process of scaffolding. The student interactions in our teaching experiments suggest to us that the context as well as the methodology and content of the investigation play a key and complementary role when complex images are being used as data.
We conclude that if we are to develop learning environments that are smart enough to support students' exploration of images as data, we need to consider each image - from the point of view of design - as an embedded learning environment in its own right. That is, each needs to include i) phenomena to reason about (e.g., images of a landscape, graphs of experimental results), ii) access to expert knowledge about the context, and iii) supports and tools both for students' attention and for their analytic skills.
In what follows, we describe the stages of our design process, elaborate the design decisions we made at each stage, and present and discuss the findings from our teaching experiments. We conclude with a discussion of the implications of our findings.
The Biocomplexity curriculum
iii
In 2006, NSF awarded a grant to TERC to develop and test Biocomplexity and the Habitable Planet, a full-year, capstone high school curriculum. The instructional materials engage high school students in the recent science of coupled natural and human systems, exploring the complex fabric of relationships between humans and the environment at all spatial and temporal scales. The Biocomplexity curriculum consists of inquiry-based investigations designed around cases in urban, suburban/agricultural, tropical, and polar systems. Students gather evidence and marshal arguments in support of possible solutions, incorporating biotic, abiotic, and social factors. Students present completed case solutions for discussion and debate at the end of each unit.
Data for these investigations include a wide range of graphs, charts, maps, photographs, and tables. Complex images provided data crucial to the rigor of students’ case solutions, yet students found them difficult to interpret. We learned important lessons about the sources of the difficulty from our pilot and field tests.
The use of data sets, and the representation of that data through visualization, can foster deeper understanding of complex relationships in science (Pozzer-Ardenghi and Roth, 2005; Gordin & Pea, 1995). However, manipulating data, and re-representing it across symbol systems (e.g., numbers, tables, images), also presents novel demands on cognition, as it relates to cognitive load and working memory (e.g. Sweller, 1988; Cowan, 2001). For example, using data sets for learning increases demands on higher-order executive functions (Edelson, Gordin & Pea, 1999). Similarly, the use of diverse visualizations of data introduces additional layers of abstraction into the learning environment, which further increases demands on student cognition (De Jong et al., 1998; Ainsworth, 1999). Moreover, moving among different representations, even within the same modality (e.g., image to graph), is known to tax working memory (Ainsworth, Bibby & Wood, 1997).
Recreating Biocomplexity as a digital text
1
With the increased interest in and demand for electronic or digital learning materials (activities, texts, and resources), the NSF funded a collaboration between TERC and Center for Applied Special Technology (CAST) in 2010 to transform two of the four Biocomplexity units into an electronic text, implemented in CAST's Universal Design for Learning (UDL) environment. Three principles for supporting student learning which underlie UDL are of particular interest for Biocomplexity: 1) Provide multiple means of representation, 2) Provide multiple means of expression and action, and 3) Provide multiple means of engagement. (See cast.org for a fuller description of the framework.) On the basis of these principles, a scaffolding approach seemed the overall best strategy to take for a curriculum that required a gradual, as-needed acquisition of scientific skills in data collection, analysis, and argumentation, as well as requiring students to gain fairly rapid familiarity with a rich array of ecological, biological, and social data about each case setting. We would thus address the level of cognitive demand presented by complex images by providing the kinds of scaffolding that would increase accessibility of the material to students.
Scaffolding as a guiding metaphor
iv
The idea of scaffolding has been closely linked to developmental theory, most notably the pioneering work of Lev Vygotsky (Reiser and Tabak, 2014; Vygotsky, 1978; Wood, Bruner & Ross, 1976). Educators have widely adopted what Stone (1993) called the metaphor of scaffolding, in part because it is accessible, and also because it seems apt in describing much of what a teacher does in supporting student learning (Palincsar, 1998). However, when applied to the design of computer-based scaffolds, the metaphor becomes problematic. Whereas teachers can use intuition and craft knowledge to inform how and when they apply and withdraw scaffolds, computer-based scaffolds are only as good as the system's knowledge engineering — the extent to which it can diagnose the student-user's learning barriers for the curriculum and suggest supports. Already, Wood et al. (1976) noted the challenge for cybernetic analogues of 'cognitive apprenticeship,' since the human tutor is holding both a model of the content and problem being undertaken, and a model of the student's understandings and learning trajectory. It has been cogently argued that the field suffers from a deep incongruence between scaffolding theory and practice and its application to computer based-learning (Puntambekar & Hubscher, 2005). As a result, we still know very little about how student knowledge changes over time when a digital environment includes scaffolding processes, or even whether the scaffolding is effective and/or efficient in supporting the construction of robust scientific concepts (Rappolt-Schlichtmann et al., 2007).
Quintana et al. (2004) put forward a scaffolding design framework for software to support inquiry science. Their goal was to facilitate the convergence of the field around a common theoretical frame that defines rationales and approaches to the design and development of scaffolding in computer-based science learning. Their framework is structured around 3 guidelines:
- Use representations and language that bridge learners’ understandings
- Organize tools and artifacts around the semantics and practices of the discipline
- Use representations that learners can inspect in different ways to reveal important properties of underlying data.
We used these guidelines, especially 2 and 3, to develop ‘smart visuals’, and we operationalized this term thus (from an internal design memo):
A visual is 'smart' if there is clear value-add, and to the extent that there is a maximal mapping with regard to pedagogical (e.g., goals, etc.), learning science (e.g., variability, cognitive load, perception, etc.), and technological (e.g., constraints and resources, etc.) concerns at the time of development.
This categorization reflects the scaffolding approach we were taking at this stage, with visual elements being designed in such a way as to bear in mind the novice-expert continuum. With this level of specificity, another assumption of our theoretical framework becomes salient: student control of the use of scaffolding supports. That is, the design as it was evolving incorporated an assumption that the tools we would build would rely on students' learning to recognize when they needed to use scaffolding tools, and which tools would move their inquiries forward.
While the curriculum included images serving a variety of functions, in this paper we concentrate on 'images-as-data.' We defined these as images that the students need to interpret to derive qualitative or quantitative data to use in an investigation, e.g., a graph of experimental results, or a photograph of a landscape whose features need to be analyzed in some way, either by visual inspection or using GIS software.
These images, central to the practice of the science being taught, were the most challenging in terms of complexity for the learner, and essential as data for reasoning about solutions to the cases in each unit. Roth, Bowen and McGinn (1999) have shown that, in comparison with graphs presenting data in professional ecology journals, graphs in high school biology texts are very poorly supported by text and captions — despite the obvious difference in background knowledge and expertise available to the two readerships. This paradoxical situation led us to the design conjecture that “data” images were a good target for the development of scaffolding designed to support students to learn ways of analysis that reflected disciplinary practices.
As we examined the Biocomplexity images, we realized that all these images had in common a learning barrier which neither Wood et al. (1976) nor Quintana et al. (2004) addressed directly: identifying signal vs. noise in a complex image. This tension is inherent to the subject matter. We have argued elsewhere (Drayton, Puttick and Donovan, 2013) that life-sciences curricula need to do a better job of engaging students with systems of increasing complexity. On this view, expert habits of mind for grappling with complex images should be embodied in the scaffolding of images being used as data.
In order to facilitate the students’ ability to distinguish signal from noise in the Biocomplexity curriculum, we created scaffolds of various kinds that incorporated expert strategies for examining complex data. These included, among others, slide shows, sometimes with associated audio clips, that provide the context for graphical images (see Figure 1 for an example) and several ways of directing the learner's attention to key aspects of complex images such as graphs or aerial photographs — by means of “hotspots” or other annotations to allow the learner to interact with the content and read more closely. An example that will be discussed later is given in Figure 2.
Teaching experiments
v
To explore students' use of these scaffolds, we conducted teaching experiments with a focus group of high-school students. In addition, we wanted to explore the actual relevance of the scaffolding metaphor to the work entailed in student analysis of Biocomplexity images. Our overarching research questions were:
- How did the students engage with the images? What did they see first, what did they tend not to see?
- Did the scaffolds constructed for each kind of image help the students “decode” and interpret the images for the purposes of the learning task they were engaged in?
- What other resources did the students deploy or request in order to interpret the images?
Our goal was to gain insight into the ways that students understood and used the Biocomplexity materials, and specifically how they manipulated and interpreted images functioning as data. The aim was to understand whether and in what ways our “smart visuals” helped the learner.
Participants
1
Four students were recruited from Somerville High School, Somerville MA, to participate in the study. Because Biocomplexity is intended as a capstone course, we asked a teacher colleague to recruit students who had taken several science courses in high school. Three students were female (pseudonymously Janica, Tashi, Amy), one was male (pseud. Andre). One student was a junior, while the other three were seniors. The students were from diverse backgrounds (Tibetan, Chinese, Hispanic, and European). All the students were in at least one Advanced Placement course, though not necessarily Environmental Science or Ecology. They had all taken biology, and were conversant with basic ecological ideas such as niche, habitat, competition, biodiversity, etc.
Methodology
2
We conducted three student focus groups that were spaced over several weeks in the winter and early spring of 2013. The focus groups took place at TERC, with researchers from TERC and CAST present.
We adapted methodology described in Nemirovsky et al. (1998), Steffe and Thompson (2000), and Engelhardt et al. (2003). The students were told about the nature of the research, and the expectations for these sessions. They were to complete one or more of the tasks in the curriculum, and talk aloud while they did so, either with each other or the instructor. The same researcher (Drayton) was instructor for all three sessions. Other researchers from the team were present, observing, and occasionally asking questions or providing technical support when the students met with an obstacle. For each session, the research team identified specific tasks for the session, and research questions for which they hoped to collect data.
Each session lasted between 90 and 120 minutes. All three were taped and transcribed, and researchers took notes in parallel. The recording of Session C was destroyed accidentally, however, so observer notes are the only data source for that session.
We made the following assumptions, in part on the basis of the previous analysis of images described in the previous section:
- We would focus on visuals that are to be used as data for interpretation and investigation.
- Visuals share complexity, and therefore demand decoding. Students would need to identify structures present and develop a working theory about the signal vs. the noise in the visual.
- Students would need to understand that a question or inquiry determines the relative importance of different components of each visual.
- Experts with experience in using visuals as data have typical or common strategies that they use to efficiently “parse” the visual, either with an explicit question or priority, or with an inventory of key structures pre-determined by the inquiry at hand. We would incorporate some of these strategies into our scaffolds for smart visuals, either in the visuals themselves, or during the focus groups as instructor moves.
Specific research questions, formulated in each teaching experiment below, were designed to address these assumptions.
Session A. Google Earth activity
3
In this session, we taught one of the early activities from the curriculum. The overall challenge is to develop the basic elements of a land-use plan for a large open area at the edge of a sprawling urban setting. Students were given an introductory lecture on basic ideas in landscape ecology, drawing a contrast between ecosystem, the unit of analysis with which they were most familiar from their biology courses, and landscape element. After this introduction, they used an activity from the Biocomplexitycurriculum. In this activity, they learned to use Google Earth to identify landscape elements, first in a familiar location and then in an unfamiliar one.
By using the basic tools, e.g., scrolling, selecting or unselecting image view options, the students quickly learned to use the 'vocabulary' of the tool, and understand which of all possible actions can and cannot be realized, and in what ways — the syntax of the tool. In grappling with images in the online environment, what Nemirovsky et al. (1998) call the “tool perspective” is both relevant and multiplex. Thus, we saw that the students came equipped with the conventions and expertise common to using most modern interfaces —pointing, clicking, dragging, dropping, menus, grabbing images and moving them (hand icon), and so on. Therefore, the students were able to focus on the performance of the interface and tools as they used their prior knowledge to interpret the image.
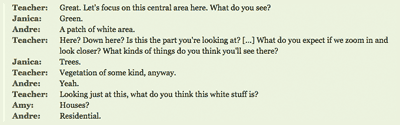
The students first registered with interest very familiar features of the area (transcript in Figure 3). The observers asked the students what cues they were using in interpreting the images. One student answered for all:
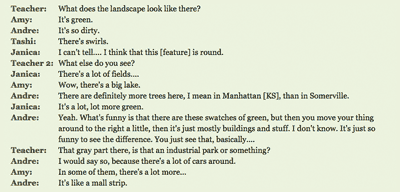
Color. Those old houses are...because all the roofs are grayish and then they blend in up the street, which is a blackish‑gray. Then you have the green trees and parks. Then you've got the blue water.
Next, we asked the students to look at images of a Kansas landscape that showed a small city set in the prairie. Once again, color was an important cue, as students interpreted a landscape that contained no familiar landmarks. Shapes were also important (Figure 4), as was discernment of specific identifiable objects as the students learned to manipulate the zoom function.
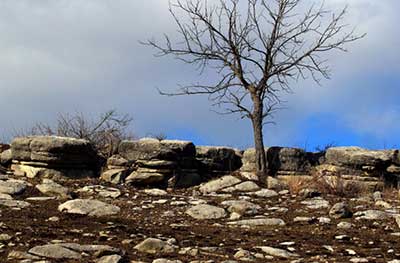
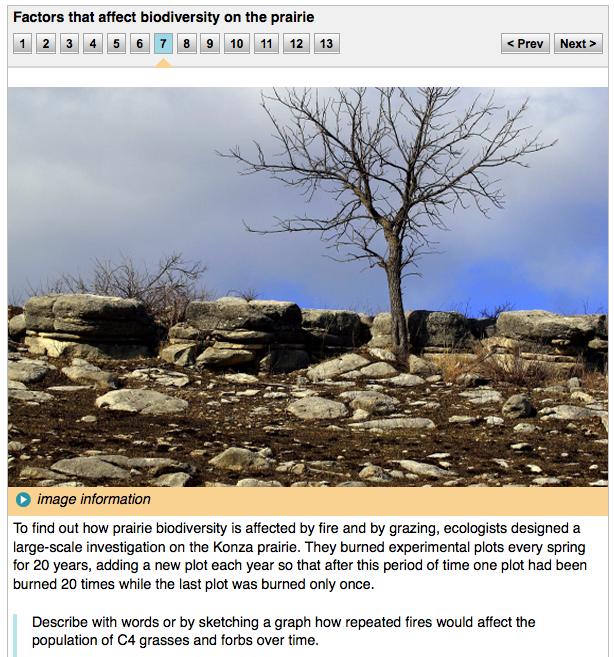
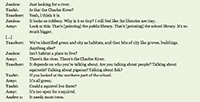
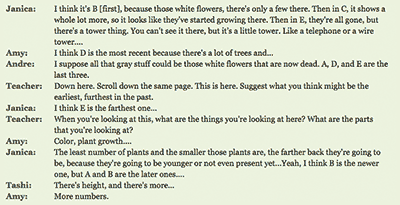
For the final segment of this session, we asked the students to do a different kind of task from the curriculum: they were given 5 photographs of an area of prairie labeled A-E, and asked to arrange them in a time series according to successional stage. In this activity, additional considerations beyond shape and color came into play, more specifically understandings of the appearance of growth and other changes over time (Figure 5), even though none of the students were actually familiar with succession in prairie systems.
Session B: Landscape analysis
4
As discussed above, we had identified images used as data for particular attention in our work. The enhancements developed for Biocomplexity were primarily intended to direct students' attention to key features of the images, to provide targeted supplementary information, to reduce noise and thereby facilitate students' use of the images to complete learning tasks. However, in order to support students' learning to analyze the complex phenomena of biocomplex situations, complexity reduction is not a prime value. Rather, the students need to learn how to reduce the complexity of the data for their own purposes. This suggested to us that supports would need to be both technical and conceptual.
To begin to explore pathways into this approach to 'smart images,' we gave our students an introductory presentation on basic concepts of landscape ecology, already introduced in Session A. We used materials from the curriculum to explain the challenge of looking at repeated elements on a landscape, more specifically, the concepts of patch, corridor, and matrix elements. We also briefly described the concept of materials or processes, e.g., movement of energy, crossing boundaries between landscape elements. We then asked them to apply these concepts to some Google Earth images of landscapes — first, again, from the Boston area, familiar territory from the first session, and then an area in Amazonia. Our overarching research questions were:
- How do the students made use of the conceptual tools we provided to examine the complex visual data of the curriculum?
- What other interpretive strategies did the students make use of in sense making?
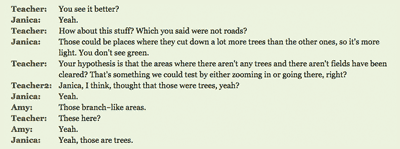
After technical issues had been solved, the teacher asked the students to talk aloud as they looked for landscape elements. As in the first session, students again focused on color first and then shapes. Yet almost immediately, the observers move from looking at these very unspecific cues to labeling, a basic kind of interpretation. The students brought in their own knowledge (and pre-conceptions), identifying components, and then starting to use the conceptual tools provided by the terms matrix, patch, and corridor to think about the landscape as a whole. Prompted by the teacher, they considered the landscape as habitat for different kinds of animals (Figure 6).
Because of their familiarity with this local landscape, their interpretations made use of considerable relevant knowledge, and were largely accurate in terms of the features of specific landscape elements. When the students moved from the familiar Boston area landscape to an unfamiliar one, Rondonia, a similar analytical pattern ensued (Figure 7).
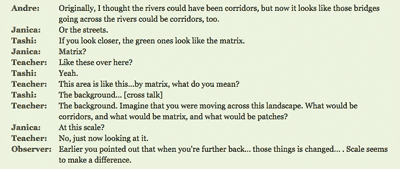
Again, the students started with the most certain cues — color, in this case, and perhaps also shape and arrangement. They were at this point adept with basic viewing tools such as zooming in and out, and even before using , were forecasting the results. Building on their interpretations of the image, they conjectured further about microclimatic conditions, and consequent animal behaviors (Figure 8). The concepts of matrix, corridor, barrier, etc. were operationalized by the addition of a particular purpose or perspective, as in analyzing the landscape from the point of view of a specific organism.
The same approach to 'decoding and interpreting' appeared when the students turned to Kansas. They had seen the area from the air by means of Google Earth before, but had now examined two other landscapes equipped with a set of concepts for parsing landscapes functionally. In the transcript in Figure 9, we again encounter the repeated moves from shapes, colors, and texture to identification, to the beginnings of a synthetic move, to "reconstruct" the landscape.
Next, the teacher asked the students to think about how water might flow in this landscape — to imagine the path of a raindrop. Providing this specific task immediately ordered the students’ reading of the landscape in a way that activated a range of prior knowledge. Some students wanted to get a better sense about the relief of the landscape: “[We'd need to know] How high certain areas are, and how low they are” and, after zooming in, “I think you can get a much better sense of that height.”
Zooming in revealed more details, such as buildings and structures such as roads or fields. On the basis of their familiarity with roads and fields in their own experience, and their focus on the path of water, they began to suggest conjectures — “Look at the road a bit more. Is that a bridge?” “Is there a culvert ...or something?”
The queries became more elaborate: “These look like fields to the right and left of that road, or that corridor if it is a river or stream or something, but humans have obviously done things to it. What would have been natural with that? Maybe not so much in the way of trees if it doesn't have so much access to water, but what would be there?”
As the session went on, students brought forward more and more knowledge about landscapes: greener areas might be at lower spots in the landscape; certain contours suggest sedimentary rock; certain linear structures might have resulted from vehicle traffic across dry grass areas; river beds may be lined with white sand; water erodes and transports soil particles. One student said:
“If you think about following the rain drop, or a bunch of raindrops, if the rain falls on the upper areas of those rocky looking plateau areas, smaller pieces of those rocks are going to get carried down.”
In sum, as the conversations became more engaged, more of the individual students' experiences and knowledge were brought into play. In a very real sense, three important factors constituted the scaffolding for the students in dealing with complexity. These were the students' prior knowledge, their discussion and argumentation about each other’s interpretations, and the question that they were trying to answer about the possible paths for rain that were discernable in the landscape.
Reflections on Sessions A and B.
5
The available scaffolding included a range of tools that enabled students to eliminate complexity and ambiguity — zooming, marking, and annotating. Zooming in and out, as with other kinds of magnification, served among other things to limit the visual field, for a particular moment, and, incidentally or not, to eliminate or limit complexity.
These were the tools available in the technology, but the actual scaffolding was done by the teacher. The students also participated in the scaffolding process as they asked questions of each other. Indeed, though the design team had been seeking to design an activity structure that would complement the tools provided, so that the two together would provide the scaffolding support necessary for engaging with data-rich images, the process of deciding which tool or strategy to use required reflection both on the students' and the teacher's part.
The most notable feature in this session, however, was the way in which the students began to bring prior knowledge to bear. That is, their interpretation of new images made use (whether correct or not) of specific content, so that this rich cognitive process no more involved a decoding of the image than negotiating one's home or neighborhood does. The students chose the most salient visual characteristics as cues to sort object types present in the photographs, and were quick to invest them with functional or historical roles. Already, therefore, the students were deploying some key disciplinary strategies, which involved conjecture on the basis of content knowledge, followed by verification procedures — and debate.
Related to this was the role that imagination played as the students ‘inhabited’ the spaces in these images. In Figure 4, when the teacher described “green” and ”city” as habitats, a student took up the notion of habitat as 'a place to live', which perhaps prompts the teacher to raise the question: habitat for whom? The students almost immediately re-imagined the space as squirrel habitat. “It's too open for a squirrel.” “It needs more trees.” This, too, is a disciplinary strategy commonly used by experts (John-Steiner 1997, Hager 1995, Keller 1984).
The cognitive processes evident in these tasks seemed to include the following, in roughly this order:
- Orientation to actual landscape: Students get basic location information.
- Fine Anatomy: Identification of component or recurrent elements, relative sizes, and meanings of colors. Students were not only noting these phenomena, but beginning to interpret (or at least label) some of the features, even absent confirmatory detail. Prior knowledge was a key resource.
- Gross Anatomy: Arrangement, connection, structure, pattern. Once the students had developed an initial inventory (perhaps not a model) of the landscape, they were then ready to look at relationships and juxtapositions. Again, interpretation was an important element, and prior knowledge deployed freely.
- The importance of purpose or question: Efficiency in doing these various analyses became dramatically better when the searcher was given a purpose. The purpose became a sorting/orientation tool, as in the “What path would a raindrop take?” thought experiment, or “If you were a squirrel, how would this look?” Adding the notion of motion across the landscape raised many questions about relationships, relative sizes or elevations, the actual nature of an element tentatively identified earlier, and so forth.
- Evaluation of conclusions and interrogation: What would I need to know to understand this better? What questions do I have? What would “ground truth” reveal? When they were engaged in this category of inquiry, students explored the limits of their knowledge resources in relation to all of the previous processes.
This exploratory pattern, collaboratively developed over the course of the session, could be seen as a good representation of “disciplinary thinking.” However, it also bears an interesting and provocative resemblance to Dewey's account of inquiry, in which the inquirer's purpose – the focus of the inquiry - drives a succession of engagements with the material of the investigation (Dewey 2008). That is, the focus of the inquiry is the most important tool for dealing with complexity.
Session C: Graphs and contexts
6
In this session, we explored how features of the Biocomplexity tools helped students interpret graphical information, and we were curious to see how the multiple means of representation provided by the digital tool might support or scaffold students’ interpretation of complex graphical data.
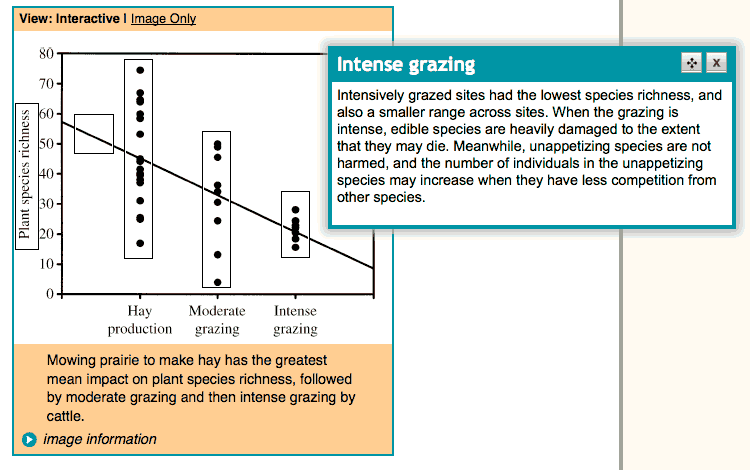
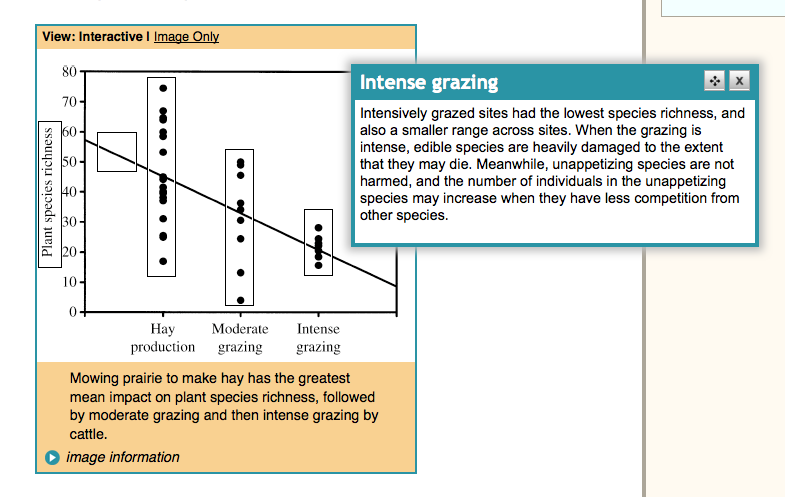
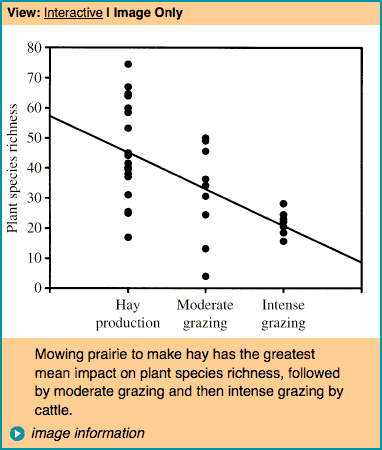
The key graph (Figure 10) presented data from an experiment reported in the primary research literature that compared the effects of three kinds of disturbance on plant species diversity. The disturbances included different intensities of grazing (moderate and intense), and a less intense simulated grazing which consisted of annual mowing, and had the largest positive impact on species richness. The experiments cast light on prairie ecosystem dynamics that might in turn provide insight for conservation and restoration efforts on similar prairie where historical processes such as seasonal bison migrations had been eliminated, but could be simulated. To provide a focus for interpretation, we asked the students the following question from the curriculum:
The graph shows the impact on prairie biodiversity of two common farming practices - gathering hay for winter (left), or putting a moderate number (middle) or large number (right) of grazers (cows or bison) to graze. What pattern of impact do you think the graph shows?
The graph was presented in the following forms:
- Scatter plot (produced from a data set provided by the study's authors)
- Scatter plot with regression line (Figure 10) as published in the curriculum, and as typical of science texts.
- The same graph with added annotations that the students could open and read when they wanted to as part of their curricular task (Figure 2).
- The annotated graph (Figure 2) accompanied by a slideshow about the experiment and its results, as well as additional information about the role of fire in prairie systems — “the story behind the experiment.”
In the focus group, our strategy for each iteration of the graph was to have the students try to put the implications of the graphs into words, note where they required more information, and whether the enhancements provided it or changed the way that they explained what they were seeing. We hypothesized that the enhancements would result in richer interpretations, for example, making more references to experimental setting, mechanisms, perhaps time or spatial scales, and the variability present in the data. We further hypothesized that, having worked with the enhanced version of the graph, the students would respond to an unfamiliar and unsupported graph with questions seeking richer contextual information. We describe each iteration in turn.
-
Scatter plot: The students were tentative in their responses as they began to answer the question. As the conversation proceeded, it appeared that the wide range of values within each treatment presented a problem of interpretation. The most definitive response, which the others endorsed, was from Tashi:
“Intense grazing is bad. There is less plant species. Because the graph goes down.”
When asked what they looked at first when presented with the graph, students agreed that first they looked at the labels on the axes, and then the data points.
-
Scatter plot with regression line (Figure 10): The trend line was an obvious feature, and the students told us that had seen something like that before. However, they couldn't quite recall the name of it at first — eventually, one suggested “Regression line,” but none of them could articulate what 'regression' meant except in the most general terms (equivalent to 'trend'). Lia appears to have counted the data points and noted their equal distribution on either side of the line, which led her to state her guess that the trend line represented “the average”:
Tashi: Is the line the average?
Janica: Line of regression? Slope?
Lia: There is the same number of dots either side of the line, so I think it’s the average.
-
The same graph, annotated: The students used the hotspot annotations (see Figure 2) and other UDL supports, especially the glossary. The 'hot spots' were indicated by rectangles that revealed additional information if clicked. They were an implementation of several scaffolding ideas:
- Textual information describing what the x- and y-axes represented
- A description of the regression line in functional terms
- A more detailed description of the specific experimental treatment involved for each set of data points.
As the students read the annotations, they stated that they found them helpful in articulating the meaning of the graph, and the net effect was to increase their confidence in their earlier answers to the question.
Teacher: What do you know about this graph you didn’t know before?
Tashi: The trend line. It’s called a trend line. Computed by standard statistical techniques, they average it. […]
Janica: I know about different sites in the prairie.
The teacher asked them next what the dots on the graph represented, hoping to elicit some comment about how it was situated in relation to the other data points — a conventional question about the students’ interpretation of the graph and answerable by means of the x- and y-axes. However, student responses were surprising, and opened up further exploration:
Teacher: What does this dot mean? Janica: It tells you that there is a lot of species. There is less species richness if there is more grazing.
[…]
Tashi: The grazing makes the plants go away. As they graze, the species richness decreases over time.
Andre: I’m still confused what each dot is…are they different trials at the same place over time?
One student then answered, “A study site.” This opened the way to conversation about why there would be such a big range in species richness within a treatment, which was most pronounced in the “mowing” treatment. Once they bore in mind that the dots represented actual places, the students were able to conclude that this range probably represented pre-treatment differences in richness at the study sites.
-
Annotated graph accompanied by slideshow: The students by this time had received enough background information when interpreting elements of the graph that the main outlines of the narration were familiar. However, the slide show provided additional context about prairie conservation and restoration, and the background out of which the research questions grew, and the students told us that the additional context would enable them to interpret the data more deeply with respect to the questions they sought to answer
-
A novel graph: Finally, we provided students with a graph of data about the effects of rabbit exclusion on plant species richness in an African experimental site. As with the prairie experiment, moderate grazing had the effect of maintaining higher plant species richness. We asked the students to interpret the data in their own words. As before, their first moves were to understand the axes, but then they asked questions about the experimental methodology until they felt satisfied that they understood how the data were collected, and the physical situation of the experimental plots. In response to our question about whether they had suggestions for an accompanying slide show, one student responded:
Andre: A slideshow would need to include info about what the rabbits like to eat.
Tashi: It would need to give a description of the experiment. About the land, and what's there.
Reflections on Session C
7
These students were familiar with such descriptive statistical ideas as measures of central tendency and variances. Our experience in pilot and field tests suggested to us that graphical literacy was not the critical barrier to students' ability to use these graphs/images in reasoning and argumentation. It was consistent with this conjecture that the addition of a trend line was not particularly helpful for the purposes of the inquiry that this curriculum required.
The other supports we provided included annotations and then a narrative slide show about the setting, the experiment, and the ecosystem being studied. It was when the students and teacher began discussing the meaning of each data point, and its relation to the experiment, that the students began to feel capable of interpretation in relation to the ecological processes at work. Interestingly, these students, who were engaged by the reasoning challenge (as opposed, for example, to seeking answers), found the slide show confirmatory, but by the same token a spoiler that short-cut the reasoning process: “it gives you all the answers.”
As the conversation continued, it appeared that the conversation about the phenomenological basis for the dots on the graph provided the students with a new resource that they then applied to the novel graph that they were presented with. This time, when asked to interpret the graph, the students began by asking questions about the experiment, the organisms, the setting — seeking the kinds of realia that actually made the graph interpretable.
Our hypothesis for this session was based on an enriched notion of what disciplinary expertise might entail for this kind of science. We initially based our model of expertise primarily upon introspection by the two members of the team who are Ph.D. ecologists. A basic tool for interpretation of this kind of data set is a concrete understanding of the actual experimental setting, including the location(s), the organisms involved, and the data-collection process, as well as the question that the scientists were addressing. Roth (2012) has called this “undoing decontextualization.” It is a complex process that involves visualization of the experimental process, and the underlying phenomena, in addition to interpretation and critique of the data.
Indeed, this imaginative work is an essential element of scientific interpretation (John-Steiner 1997), because it is needed for the development of the possible implications of one's empirical tests. Speculation about possible implications must be based upon, and relatable to, both the data in hand and to established theory. It moves both 'downward' to basic principles of the science, and 'forward' to possible extensions or applications of the new understanding (Ramón y Cajal, 1999). After results have been obtained, a second stage of scientific interpretation involves de-contextualization in which the investigator identifies and characterizes conclusions and implications that may have value beyond the specific study setting. This may be warranted in part by the theoretical framework within which the study was set, and may also constitute a hypothesis for further investigation. For an expert in the field, this decontextualized summary of the results is interpretable because of her broad acquaintance with contextual information.
This recontextualization is a key process in science learning as well, which means that investigations must necessarily take place in a highly contextualized form. However, for a student with little or no knowledge of the field, the lack of such contextual information is a major barrier to the use of the results of a study in an instrumental and fruitful way. From the point of view of inquiry-based science education, it is not enough to provide surround that supports students to decipher the claims embodied by a graph (Roth and Bowen, 2003). Students must also be helped to understand how the situation of the study gives rise to the data and to use this towards construction of a model-based understanding (sensu Driver et al., 1996).
On these considerations, therefore, we were brought to an enriched understanding of the problem of scaffolding in an innovative curriculum like Biocomplexity, and thus of what affordances of a web-based text might help implement a reframed approach to scaffolding for inquiry. Indeed, it led us to begin to reconsider what smart images might be.
Implications and next steps
vi
Revisiting the design challenge
This paper describes how engagement with learners led us to critique good design decisions made in order to transform a high-school capstone course from print to electronic form. In the course, students address land-use and resource-use challenges by gathering evidence and marshaling arguments in support of possible solutions, incorporating biotic, abiotic, and social factors. They present completed case solutions for discussion and debate at the end of each unit. Data for their investigations include a wide range of images, including graphs, charts, maps, satellite images, and photographs. The students must interpret these to find evidence relevant to the solution they are proposing, and then mobilize that evidence to create a case report that articulates and justifies their solution. Thus, complex images provide data crucial to the rigor of students’ case solutions, yet students find them difficult to interpret.
During previous testing of the curriculum, we came to see that the challenges of teaching and learning biocomplexity rested, in part, on the cognitive demand of the learning tasks that required students to directly manipulate and work with various images-as-data to make meaning. This increases demands on higher-order executive functions and introduces additional layers of abstraction.
Because complex images present a difficult interpretation challenge for students, we focused on disciplinary strategies used by experts when they interpret complex images. We drew on these as we designed supports for students to engage with and inquire into such images effectively. Our experience over the course of the project broadened our understanding of what ‘disciplinary strategies’ can mean.
Recapping the basic approach
2
Initially, we chose two strategies to scaffold student learning using complex images. Universal Design for Learning principles include providing multiple means of representation, multiple means of (student) expression and action, and multiple means of student engagement. At this stage, a 'smart visuals' approach in our view included adopting a scaffolding model or framework originally developed by Quintana et al. (2004) that includes 3 guidelines: use representations and language that bridge learners’ understandings; organize tools and artifacts around the semantics and practices (or syntax) of the discipline; and use representations that learners can inspect in different ways to reveal important properties of underlying data.
Although the curriculum included many types of images, we focused most of our attention on images from which learners needed to extract qualitative or quantitative data to use in an investigation. We examined ways that we could make disciplinary expertise and strategies explicit for the learners in the various images directly.
Key findings from each session
3
In the first teaching experiment with high school students (Session A), in which they examined a Google Earth image of the neighborhood of their high school, we were struck by how quickly students began to deploy some key disciplinary strategies, e.g., choosing the most salient visual characteristics as cues, investing them with functional or historical roles, and zooming in and out to limit or expand complexity. In Session B, students brought to bear three important factors in dealing with complexity: prior knowledge, their discussion and argumentation about each others' interpretations, and the question that they were trying to answer.
In Session C, students engaged with graphical data from an experiment drawn from the primary literature. As already mentioned above, our hypothesis for this session was based on an enriched notion of what disciplinary expertise might entail for this kind of science – that is, a concrete understanding of the actual experimental setting, including the location(s), the organisms involved, and the data-collection process, as well as the question that the scientists were addressing. When students encountered this information as a slideshow related to the graphical data (as shown in Figure 10), it immediately enhanced their ability to interpret the decontextualized data represented in the graph. Knowing how the situation of the study gave rise to the data helped them construct a model-based understanding as they posed further questions about the scientists’ methodology that further illuminated their understanding of the results of the study.
In these teaching experiments, we found that, as students reported their thinking and sense–making about the images, issues of decoding and analyzing the formal structure of visual data were quickly superseded by processes of interpretation that required domain knowledge. Indeed, the very process of decoding the complex images required the use of interpretive categories or concepts, which implied a level of knowledge of concepts, phenomena, and practices that went well beyond the process of scaffolding. Thus, while we agree with the objective of incorporating disciplinary expertise in the supports we design for student use of visual data, we have come to see that this expertise must include considerable domain knowledge about phenomena – the semantics of the discipline, to use the description of Quintana et al. (2004). The designer's challenge is to make relevant data accessible and usable, and motivate for the teacher the investment of time necessary to learn this kind of information.
We conclude that if we are to develop learning environments that are smart enough to support students' exploration of images as data, we need to consider each image - from the point of view of design - as an embedded learning environment. That is, each needs to include: i) phenomena to reason about (e.g. images of a landscape, graphs of experimental results); ii) access to expert knowledge about the context; and iii) supports for students' attention and analytic skills.
Main goal of the study, and conclusions
vii
In our early development discussions of smart images and scaffolding, we had focused on expert ways of looking at an image, and expert ways of confronting complexity. However, our discussions of scaffolding tended to focus on processes (including syntactic supports), rather than semantic ones as we categorized the ways in which images could be made ‘smart’.
By syntactic supports we mean the processes and sequences that guide the way that the learner encounters and interacts with content. This is obviously an important approach to the design of learning environments. It is firmly in the tradition of cognitive apprenticeship (Collins and Kapur, 2014; Wood et al., 1976). It is also in keeping with much advanced thinking about the design of learning environments, in which the social and material context is seen to play a central role in learning (Stahl et al., 2014; Salomon, 1993). On this view of learning, both content and cognition are distributed within the learning situation, including both the other humans who are part of the learning system, and the artifacts and resources available — in Barab and Plucker's (2002) memorable phrase, “smart contexts”.
However, the student interactions in our teaching experiments suggest to us that the meanings of the context, as well as the content of the investigation, both of which constitute the semantics of the inquiry — play a key and complementary role when complex images are being used as data. Indeed, the students' comments show that, when complex data are presented, they must be transformed into language — either words or numbers — if they are to be used in any kind of knowledge building. This necessitates an iterative process of identification (or even taxonomy), model-building, and empirical review, all of which at some point require the use of domain knowledge.
The implication is that if we are to develop learning environments that are smart enough to support students' exploration of an image as data, they need to include both phenomena to reason about (e.g. images of a landscape, graphs of experimental results) and expert knowledge about the context, in addition to supports to guide students' attention and analytic skills (Hawkins, 1974). Thus, when we provided students with insight into the concrete details of an experimental procedure, they were much more able both to interpret a graph of results and to engage imaginatively with the experiment and its meanings than before. Similarly, when the students were interpreting a landscape in Google Earth, they articulated a desire for a 'street view' of the study site — that is, ground level, person-on-the-ground view — as their shared interpretation proceeded.
We have moved beyond the scaffolding model as conceptualized by Quintana et al. (2004). That is, our work with visuals as data suggests that the syntax of practice, and the 'substance' of core disciplinary ideas (Schwab, 1978) are not sufficient for students to fully engage with images that constitute complex data requiring interpretation. A considerable amount of specific information about phenomena and settings is also essential, and we suggest that this, together with Schwab's “substance” constitute the semantics that need to be at play in reasoning about rich visual data. While Roth (2012) speaks of “undoing decontextualization,” we see the need to enhance the contextualization necessary for effective inquiry. This includes the building up of taxonomies of objects in an image (as in Session A), the instrumental deployment of frames of reference, theories, and purposes (Dewey, 2008) (as in Session C), and the use of a knowledge base of related phenomena (as in Session B).
At the moment of the emergence of expert systems (Feigenbaum, 1991; Charniak and McDermott, 1985) in the field of artificial intelligence, researchers realized that what made these systems truly intelligent was not the power of the inference engines but the knowledge base about which the system was to reason. In a sense, we seem to be in a situation analogous to this with regard to smart images that represent data to be interpreted. Thus, the 'expert' in 'expert systems' came to be understood in two senses: expert-like behavior, which was founded on knowledge engineering that drew on the skills of expert practitioners, and also the domain knowledge of expert practitioners.
In a similar fashion, providing effective resources for students’ learning to make sense and inquiries of complex images will require these two things. First, students' investigative and sense making skills will need to be supported. Second, students will require access to a version of the sort of knowledge base that enables effective and increasingly expert reasoning and model building.
The implication is that the effective use of digital resources to support students in making expert–like sense of complex visual phenomena will require each 'smart image' to be designed as a curriculum unit itself, if the environment is to provide sufficient support for students' effective use of visual data. This does not mean simply that the piece should be well-designed with respect to its use and users, but rather that it is designed as an exploratory environment, which is 'smart' not because of its syntactic richness, but because of its semantic resources.
Such resources play some role as supports for the growth of student understanding using a different metaphor than scaffolding, as construed for electronic environments by scholars such as Quintana et al. (2004). The differences lie in the locus of control or guidance, and how resources are deployed (Puttick, Drayton and Karp, 2015). In brief, scaffolding depends crucially on the presence of a tutor or learning guide, who as Wood et al. (1976) put it, is working with two, coupled, models. The first is a model of the task space (content, tools, solution paths); the second is a model of the learner — not the idealized learner, but the particular learner whose learning is being scaffolded. On the basis of these models, and the data provided in interaction with the learner, the tutor makes a judgment about the learner's zone of proximal development in relation to available supports that the tutor or the environment may provide.
An 'intelligent tutor' can simulate some of these processes, by constraining the subject domain, and reifying some judgments about the user's situation and various productive paths towards the learning goal. For example, a learning environment such as the WISE system (https://wise.berkeley.edu/) (Slotta and Linn, 2009) can provide sequence and structure for a scientific inquiry experience. However, with the Biocomplexity curriculum our aim was to help students think biocomplexly, learning to apply the biocomplexity theoretical framework to real-world data — including images — in which variability and complexity are an integral part of the information about the problem being explored. Rather than being a task or operation that can be scaffolded, this represents an inquiry space.
Framing the design challenge in this way, we suggest that an image-as-data should be structured with the following elements, to be deployed selectively by the student as she refines her questions, develops her theory about the data set, and identifies additional investigations necessary to create a coherent account of the phenomena under question:
- Tools for focus and simplification
- Tools for annotation and prototyping
- A database of information on:
- Data sources and methods of collection
- Context (e.g. geographic, climatic, natural history of organisms)
- Background on original study purpose and design.
Thus, each image including these elements will in effect be an inquiry landscape with layers that can be added or removed by the student, and with contact points that provide access to additional information about a selected data point or points. For us, scaffolding goes beyond the framework recommended by Quintana and colleagues, since in such a complex setting, it cannot be separated from apprenticeship and collaboration in the process and discipline of inquiry.
Footnotes
viii
[1] NSF award DRL 06-28171
References
ix
Ainsworth, S. E. (1999).
The functions of multiple representations. Computers and Education, 33, 131-152.
Ainsworth, S. E., Bibby, P. A., & Wood, D. J. (1997).
Information technology and multiple representations: new opportunities – new problems. Journal of Information for Teacher Education, 6, 93-104.
Barab S. A. and J.A. Plucker (2002).
Smart people or smart contexts? Cognition, ability, and talent development in an age of situated approaches to knowing and learning. Educational Psychologist 37:165-182.
Charniak, E., and D. McDermott (1985).
Introduction to artificial intelligence. New York: Addison-Wesley Publishing.
Collins, A. and M. Kapur (2014).
Cognitive apprenticeship. In Sawyer, R.K.,. ed., The Cambridge Handbook of the Learning Sciences, 2nd ed. Cambridge: Cambridge University Press. pp. 109-127.
Cowan, N. (2001).
The magical number 4 in short-term memory: a reconsideration of mental storage capacity. Behavioral and Brain Sciences, 24, 87-114.
De Jong, Ainsworth, Dobson, van der Hulst, Levonen, Reimann, et al. (1998).
Acquiring knowledge in science and math: The use of multiple representations in technology-based learning environments. In Van Someren, M.W., H.P.A. Boshuizen, and T. de Jong, eds., Learning with multiple representations. Amsterdam: Elsevier Science. pp. 9-40.
Dewey, John. (2008).
Logic: the theory of inquiry. In Boydston, Jo Ann. The later works of John Dewey, 1925-1953. vol 12. Southern Illinois University Press, Carbondale, IL.
Driver, R., Leach, J., Millar, R. and Scott, P. (1996).
Young people's images of science. Buckingham: Open University Press.
Edelson, D. C., Gordin, D. N., & Pea, R. D. (1999).
Addressing the challenges of inquiry-based learning environments through technology and curriculum design. Journal of the Learning Sciences, 8(3&4), 391-450.
Feigenbaum, E. A. (1991).
Expert systems: principles and practices. Knowledge Systems Laboratory Report No. KSL 91-79. Stanford, CA: Dept. of Computer Sciences, Stanford University
Gordin, D. N., & Pea, R. D. (1995).
Prospects for scientific visualization as an educational technology. Journal of the Learning Sciences, 4(3), 249-279.
Hager, T. (1995).
Force of Nature: the life of Linus Pauling. New York: Simon & Schuster.
Hawkins, D. (1974).
I, Thou, and It. In Hawkins, D. The informed vision. New York: Agathon Press, Inc. pp 48-62.
Keller, E.F. (1984).
A feeling for the organism: the life and work of Barbara McClintock. New York: Times Books
John-Steiner, V. (1997).
Notebooks of the mind: Explorations of thinking. Oxford: Oxford University Press.
Nemirovsky, R., Tierney, C., and Wright, T. (1998).
Body motion and graphing. Cognition and Instruction 16:119-172.
Palincsar, A.S . (1998).
Keeping the metaphor of scaffolding fresh — a response to C. Addison Stone's "The Metaphor of scaffolding: its utility for the field of learning disabilities." Journal of Learning Disabilities 31:370-373.
Pozzer-Ardenghi, L. and W-M. Roth (2005).
Making sense of photographs. Science Education 89:291-241.
Puntambekar, S. & Hubscher, R. (2005).
Tools for scaffolding students in a complex learning environment: What have we gained and what have we missed? Educational Psychologist, 40(1), 1-12.
Puttick, G., B. Drayton, and J. Karp (2015).
Digital curriculum in the classroom: Authority, control, and teacher role. International Journal on Emerging Technologies in Learning. 10 (6):11-20
Quintana, C., Reiser, B. J., Davis, E. A., Krajcik, J., Fretz, E., Duncan, R. G., Kyza, E., Edelson, D., & Soloway, E. (2004).
A scaffolding design framework for software to support science inquiry. The Journal of the Learning Sciences, 13(3), 337-386.
Ramón y Cajal, S. (1999).
Advice for a young investigator. Cambridge, MA: MIT Press.
Rappolt-Schlichtmann, G., Tenenbaum, H. R., Koepke, M. F., & Fischer, K. W. (2007).
Transient and robust knowledge: Contextual support and the dynamics of children’s reasoning about density. Mind, Brain, and Education, 1(2), 98-108.
Reiser, B.J. and I. Tabak (2014).
Scaffolding. In Sawyer, R. K., ed. The Cambridge handbook of the learning sciences, 2nd edition. Cambridge: Cambridge University Press. pp. 44-62.
Roth, W-M. (2012).
Undoing decontextualization, or How scientists come to understand their own data/graphs. Science Education 97:80-112.
Roth, W-M. and G.M. Bowen (2003).
When is a graph worth ten thousand words? An expert-expert study. Cognition And Instruction, 21(4), 429–473
Roth, W-M., G.M. Bowen, and M.K. McGinn (1999).
Differences in graph-related practices between high school biology textbooks and scientific ecology journals. Journal of Research in Science Teaching 36:977-1019
Salomon, G., ed. (1993)
Distributed cognitions: Psychological and educational considerations. Cambridge, MA: Harvard University Press.
Schwab, J.J. (1978).
Education and the structure of the disciplines. In Westbury, I and N.. Wilkof, eds, Science, Curriculum, and Liberal education. Chicago: University of Chicago Press. pp 229-272.
Slotta, J.D. and Linn, M. (2009).
WISE science: Web-based inquiry in the classroom. New York NY: Teachers College Press.
Stahl, G., Koschmann, T., and Suthers, D. (2014).
Computer-supported collaborative learning. In Sawyer, R.H., ed., The Cambridge handbook of the learning sciences, 2nd. ed. Cambridge: Cambridge University Press. pp. 479-500.
Steffe, L.P and Thompson, P.W. (2000).
Teaching experiment methodology: Underlying principles and essential elements. In R. Lesh and A.E. Kelly (eds.) Research design in mathematics and science education. Hillsdale, NJ: Erlbaum. pp. 267-307.
Stone, C.A. (1993).
What is missing in the metaphor of scaffolding? In. E. Forman, N. Minich, and C.A. Stone, eds., Contexts for learning: Sociocultural dynamics in children's development. New York: Oxford University Press. pp. 169-183.
Sweller, J. (1988).
Cognitive load during problem solving: effects on learning. Cognitive Science, 12, 257-285.
Vygotsky, L. S. (1978). Mind in Society: Development of higher psychological processes. Cambridge, MA: Harvard University Press.
Wood, D., Bruner, J., & Ross, G. (1976). The role of tutoring in problem solving. Journal of Child Psychology and Psychiatry and Allied Disciplines, 17, 89-100.
About the Authors
x
Brian Drayton, Ph.D., co-directs the Center for School Reform at TERC, a nonprofit research organization in Cambridge, MA. A plant ecologist working in science education since the 1980s, projects have included (with Joni Falk) research and development on electronic communities of practice and on inquiry learning and technology use in secondary school classrooms. Other work (with Gillian Puttick and others), as part of the TERC Life Sciences Initiative includes curriculum development and research in life science, ecology, and climate change education. Current interests focus on the nature of communities as science educators, and on discourse processes and cognition about science and on processes of curriculum design.
Gilly Puttick, Ph.D., has a broad background in biology and biology education and has worked as an educational researcher and curriculum developer at TERC for almost 25 years. As a PI and co-PI, she has directed many federally funded education research and development projects, and focuses her efforts on bringing fresh scientific discoveries to formal and informal settings through designing, developing and testing curriculum, programs and activities for students and teachers. With Drayton, she is co-leader of the Life Sciences initiative at TERC. This group seeks to understand the nature of students’ encounters with living systems through laboratory experiences, and the extent to which these are inquiry-based.