
A Designer Speaks
Designing Assessment of Performance in
Mathematics
Malcolm Swan and Hugh Burkhardt
MARS: Mathematics Assessment
Resource Service
Shell Centre Team, University of Nottingham
Abstract
i
Curricula that value mathematical practices will only be
implemented effectively when high-stakes assessments recognise and
reward these aspects of performance across a range of contexts and
content. In this paper we discuss the challenge of designing such
tests, a set of principles for doing so well, and strategies and
tactics for turning those principles into tasks and tests that work
well in practice.
1. Introduction
1
Most people concerned with education recognise the necessity
for assessment, but would like to minimise its role. Parents accept
tests as necessary hurdles on the route to valuable qualifications
for their children, but are concerned at the pressure and the
consequences of failure. Teachers accept the importance of tests, but
see them as a disruption of teaching and learning. Politicians value
tests as the key to accountability and the way to prove the success
of their initiatives, but want to minimise the costs and the
pressures on them that complex tests generate. All would like the
tests to be unobtrusive, simple, objective, “fair”, predictable, and
accessible. In most countries, these various motivations have led to
high-stakes tests that assess only a narrow subset of the important
elements of mathematical performance.
This paper articulates some of the mathematical performance goals
that are valued around the world, and shows how current high-stakes
models of assessment impede the realisation of these goals. It goes
on to describe and illustrate design principles that, when followed,
improve the alignment of assessment and curriculum goals.
Finally, we comment on the process of implementing improved
assessment, turning principles into practice in a way that the system
can absorb, without undermining the widely-shared good intentions; in
this we seek to complement the lead paper in this issue (ISDDE, 2012), where the ISDDE
2010 Working Group on Assessment looks at assessment design issues
from a policy perspective.
2. Aligning tests to curriculum goals
2
It appears self-evident that assessment should strive to assess
those aspects of performance that are highly valued, otherwise there
is a danger that it will undermine the learning goals for mathematics
education. We therefore begin by briefly reviewing these goals, and
how well assessment reflects them.
Across the world, the aspirations exhibited in curriculum documents
are strikingly similar (Askew,
et al. 2010). They typically emphasise the societal, personal and
intrinsic value of studying mathematics, describe the fundamental
processes (or practices) that need to be developed and list the
content domains that should be covered. These aspirations are rarely
reflected, however, in high-stakes assessments, which almost
universally focus on assessing specific concepts and technical skills
in isolation from each other and their use in “doing mathematics”.
In the English national mathematics curriculum, for example, current
documents describe the importance of developing key ‘concepts’
(competence, creativity, applications and implications, critical
understanding) and ‘processes’ (representing, analyzing, interpreting
and evaluating, communicating and reflecting), before listing the
content to be covered (in number, algebra, geometry and data
handling) (QCA, 2007). The
content description is the most extensive part of the document and is
currently the only part taken seriously in high-stakes assessment.
In the US, the Curriculum and Evaluation Standards of the National
Council of Teachers of Mathematics Standards (NCTM 1989, 2000)
have similar aspirations. They emphasise the importance of problem
solving, communicating, reasoning, and making connections, along with
concepts, procedures and dispositions. The recent Common Core State
Standards for Mathematics (NGA
& CCSSO 2010) share these priorities; they emphasise the
importance of both technical procedures and understanding, along with
the development of eight ‘mathematical practices’ that include making
sense, reasoning, constructing arguments, modelling, choosing and
using appropriate tools, attending to precision, making use of
structure, and regularity in repeated reasoning. Currently in the US,
the assessment of these practices is absent in most assessments;
there is a large-scale program to change that mismatch. The outcome
in state tests will be crucial in improvement efforts.
The high performing countries along the Pacific Rim, which many
western countries are striving to emulate, share similar values. In
Singapore, the current curriculum has mathematical problem solving at
its heart, and is summarized by the five interrelated components of
concepts, skills, processes, attitudes and metacognition (Soh 2008). The concepts and
skills aspects are subdivided into mathematical content areas
(numerical, algebraic, etc.) and the processes into reasoning,
communication, connections, applications and modelling. The Chinese
national curriculum reform stresses the importance of students
becoming more creative. “‘Exploration’, ‘co-operation’,
‘interaction’, and ‘participation’ are central leitmotifs of its
theory of student learning (Halpin
2010, p. 259). In Korea,
Lew (2008) summarises the ‘ultimate goal’ of the curriculum as to
cultivate students with a creative and autonomous mind by achieving
three aims: (i) to understand basic mathematical concepts and
principles through concrete and everyday experiences; (ii) to foster
mathematical modelling abilities through the solving of various
problems posed with and without mathematics, and (iii) to keep a
positive attitude about mathematics and mathematics learning by
emphasizing a connection between mathematics and the real world.
However, examples of Chinese and Korean tests that we have seen
suggest a similar hiatus between the goals and the tasks that assess
student progress.
Across the world, therefore, we share values that embrace the
content, processes and ‘habits of mind’ that enable students to use
mathematics effectively in problem solving in the outside world and
within mathematics itself (e.g.Burkhardt & Bell 2007; Burkhardt & Pollak 2006;
Cuoco, et al. 1996; Schoenfeld 2007; Schoenfeld 1985).
The importance of improving the alignment between assessment
and curriculum goals is recognised internationally, particularly
where narrow tests are undermining the achievement of those goals.
The NCTM Standards stress that “assessment practice should mirror the
curriculum we want to develop; its goals, objectives, content and the
desired instructional approaches”, adding:
"An assessment instrument that contains many computational items and
relatively few problem-solving questions, for example, is poorly
aligned with a curriculum that stresses problem solving and
reasoning. Similarly, an assessment instrument highly aligned with a
curriculum that emphasises the integration of mathematical knowledge
must contain tasks that require such integration. And, for a
curriculum that stresses mathematical power, assessment must contain
tasks with non-unique solutions." (NCTM
1989, pp. 194-195).
Below we focus on this core design challenge: How can we design
assessment tasks that enable students to ‘show what they know,
understand and can do’, particularly with reference to problem
solving and reasoning (Cockcroft
1982)? We also address the design of scoring schemes that assign
credit for the various aspects of performance and a process for
building balanced tests from tasks.
3. The role of assessment in defining the curriculum
3
Assessment of performance is an important part of learning in
any field, whether it be playing a sport or a musical instrument, or
doing mathematics. It should provide formative feedback to the
learner and teacher that should help guide future study and
occasional summative feedback on achievement for accountability and
other purposes.
The apparent objectivity, simplicity and value-for-money of
straightforward ‘basic skills’ tests make them superficially
attractive to many teachers, parents and politicians. It is often
argued that, although such tests only measure a restricted range of
performances, the results “correlate well” with richer measures that
are better aligned with curriculum goals. Even if true, this is no
justification for narrow tests, because of the damaging ‘backwash
effect’ that they have on the curriculum. In a target driven system
where examination results have serious consequences: What You Test Is
What You Get (WYTIWYG). Since tests purport to embody the targets
society sets for education, this seems reasonable; but if the tests
cover only a subset of the performance goals, they distort learning. WYTIWYG is regarded
as obvious and inevitable by most teachers and ‘teaching to the test’
is regularly observed by those who inspect schools (e.g. Ofsted 2006), but it is too
often ignored in assessment policy and provision. To make progress,
it must be recognised that high-stakes assessment plays three roles:
- Measuring performance across the range of task-types used.
- Exemplifying performance objectives in an operational form
that teachers and students understand.
- Determining the pattern of teaching and learning activities
in most classrooms.
If the tests fail to reflect the learning goals in a balanced
way, roles B and C mean that classroom activities and learning
outcomes will reflect that imbalance.
The backwash effect of a test is not just limited to its content. The
form of the test will directly influence the form of the tasks given
in classrooms. “A multiple choice test of ‘knowledge in bits’ will
lead to ‘teaching in bits’” (Stobart
2008, p. 104). The predictability of a test will determine whether
the teacher focuses on deep or superficial learning. Teachers often
try to categorise and predict which types of questions will appear in
the exam and train students to recognise these standard types; yet
the ability to tackle unfamiliar problems is the essence of “problem
solving”, a universally accepted goal.
To summarise in rather more technical terms, the implemented
(or enacted) curriculum will inevitably be close to the tested
curriculum. If you wish to implement the intended curriculum, the
tests must cover its goals in a balanced way. Ignoring Roles B or C
undermines policy decisions; accepting their inevitability has
profound implications for the design of high-stakes tests.
This can be an opportunity rather than, as at present, a problem.
Both informal observation (e.g. with well-engineered coursework) and
research (e.g. Barnes, et
al. 2000) have shown that well-designed assessment can be a uniquely
powerful lever for forwarding large-scale improvement.
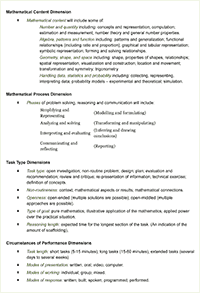
4. Performance goals in mathematics
4
From a strategic perspective, four kinds of tools are needed to
enable a planned curriculum change to be implemented as intended –
standards, teaching materials, professional development support, and
assessment that all reflect the same range of goals. In this paper we
seek to link the first and last of these.
Most countries adopt a set of national standards that provide an
analytic description of the elements of the intended domain of
learning. These descriptions, however, do not define performance
goals. In England and the US, for example, the standards describe
‘key processes’ or ‘mathematical practices’ that have ‘longstanding
importance in mathematics education’ (NGA & CCSSO 2010), yet remain neglected in
many classrooms. These processes could be regarded as independent (of
the content and of each other), and assessed separately, or as
elements in an integrated problem solving process. These are very
different kinds of performance. This is not an academic issue; it was
the decision to test the elements of performance separately through
short items that undermined the intended performance goals of the
1989 National Curriculum in Mathematics in England and led to the
current almost-process-free curriculum.
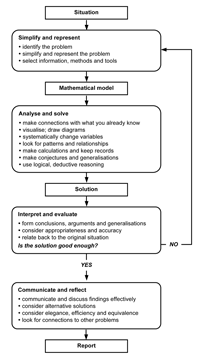
The overarching aim of these curriculum documents is to align
the mathematics curriculum and assessment with authentic examples
of thinking with mathematics about problems in the outside world
and in mathematics itself. For this the ‘practices’ and ‘processes’
have to be integrated into coherent performances, such as that of
the standard modelling problem solving diagram, a version of which
is shown in Figure 1.
Such dangerous ambiguities will be sharply reduced by exemplifying
the tasks to be used in assessment, along with their scoring
schemes, and by specifying the balance of different task types in
the tests (Role B above). The principles and methods for the design
of assessment outlined below, if adopted, will ensure that the
tasks and tests provide essential support for the classroom
implementation of the intentions of the curriculum (Role C above).
Assessment that covers the range of goals in a balanced way will
encourage teachers and schools to take these goals seriously, and
will reward their students’ achievements. The indicator of success,
reflecting C, is that teachers who teach to the test are
led to deliver a rich and balanced curriculum.
The argument can be taken further. Do we therefore assess:
extended project work; collaborative tasks; practical tasks; oral
tasks; computer-based tasks? All these are well worth
consideration; however, in this paper we focus mainly on what can
be, and has been, achieved within the constraints of timed written
high-stakes examinations.
5. Principles for assessment design
5
We propose eight principles that should underpin the design of
high stakes assessment in Mathematics. Although, as we have seen,
these principles are neglected in most current assessment of
Mathematics, they are commonplace in other subjects, from which
mathematics and science assessment has much to learn. More directly,
there are plenty of examples of past UK public examinations in
Mathematics, and those in other countries, that are based on similar
principles. We describe some of them below.
Many of our current assessment practices obstruct the implementation
of these principles. A classical approach to assessment design, for
example, is to begin with a list or matrix of the various elements of
content and processes to be assessed. Items are then designed to
assess each element separately. This is done for both accountability
and pragmatic reasons: it is then easy to show that the content
domain has been “covered”, and it is easy to distribute task design
among different writers and papers. The result is a collection of short tasks that
only assess separate elements of the subject in a disconnected,
piecemeal way.
This fragmentation is taken further by the scaffolding that is
introduced within tasks. This is usually done to facilitate the
scoring of the work, and to tie the elements more directly to the
test specification. In effect, however, this reduces the cognitive
demand still further, resulting in trivialisation. A recent
analysis of examination papers revealed that the overwhelming
majority of items tested only superficial procedural knowledge and
were extremely short (≤ 3 points, taking a few minutes at most)
compared to other subjects (Noyes,
et al. 2010).
This is a travesty of performance assessment in mathematics. If
English were assessed in an equivalent way, it would test only
spelling and grammar through short items, with no essays or other
substantial writing.
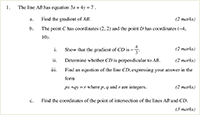
Figure 3 shows a typical
example of a structured examination task assessing algebraic
skills, designed for 16-18 year old students. It is clearly
structured to separate the elements of performance and to make the
scorer’s task straightforward (the scores for each step are printed
on the paper). There are no questions here, just instructions to be
followed. Tasks are often structured in this way to reduce the
range of answers that will be produced, and to reduce the
possibility that the student will carry over errors from one part
to the next. This structure does, however, remove all opportunities
for the student to make mathematical decisions. Compare this with
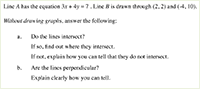
the following revised version (Figure
4) that reveals the essence of the task more clearly and retains
opportunities for the student to reason mathematically.
The negative classroom backwash effects of over-structured
assessments have led to calls for improved examinations that better
assess conceptual understanding and problem solving (e.g. ACME, 2011; Ofsted, 2012). In order for this to be achieved
it is necessary to increase the length of typical items so that
examinations promote chains of reasoning rather than recall. This
presents a difficult challenge for assessment designers. Increasing
the length of tasks increases their total cognitive load.
The difficulty of a task is not simply that of its constituent parts but is rather
determined by the interaction of its complexity,
unfamiliarity and technical demand. Assessing task difficulty cannot
be done reliably by task analysis, but only by trialling with
appropriately prepared students – the usual way well-engineered
products in any field are developed. If needed, in the light of the
designer’s insight and feedback from trials, scaffolding can be added
to give students easier access, and to produce a well-engineered ramp
of difficulty, within the task and across the examination.
6. The process of task design: some issues, strategies and
tactics
6
On the face of it, the assessment of problem solving is
straightforward. We set a problem, and then assess how well a student
can solve it. Difficulties arise, however, when we try to pose the
problem in a form which is clear and accessible to all the students,
and which elicits useful information regarding their mathematical
practices. Realising the principles stated above raises a range of
issues for designers. Here we shall briefly address the following: type
of task required; intended difficulty; scaffolding and transparency;
context and authenticity; language and layout; efficiency and use of
examination time; accessibility and differentiation. In doing so we
shall say something of the strategies and tactics that skilled
designers of broad-spectrum assessment of mathematics have developed
over the last few decades so as to ensure that their products are
well-engineered, i.e. that they work well in realising the intentions
in the hands of typical users – in this case, examination providers,
examiners, students and their teachers. In the following section we
will consider issues of scoring.
Type of task required
1
Assessment tasks should reflect their intended purpose. While
diagnostic assessment, for example, may need to focus on specific
criteria, so that particular misconceptions and errors may
subsequently be unraveled and explored in depth through focused
teaching, summative assessment tasks usually require a more
integrative approach, giving an overview that shows how well students
are able to connect concepts and processes together (Swan, 1993).
Most tasks aligned to the values described above will be designed to
assess content knowledge and mathematical processes/practices. Those
that assess content knowledge will tend to make it clear in the task
what content knowledge is required. Thus a task that is designed to
assess students’ knowledge of Pythagoras’ theorem must make it clear
that this is the knowledge to be deployed. If a task is designed to
assess problem solving, however, it will not specify which method is
to be used.
Students must decide this for themselves. Thus a collection of
problem solving tasks cannot a priori cover a particular
content domain. A balanced assessment will contain tasks of each
type, but it remains difficult to assess specific content and
practices in the same task.
Difficulty of a task
2
The difficulty of a problem-solving task is not only related to the
difficulty of the skills and concepts involved, but also on its complexity
(from a simple calculation to a complex synthesis), its reasoning
length (the maximum length of time students are expected to work
between successive prompts), its degree of unfamiliarity
(the extent to which it differs from tasks that are in the normal
curriculum or contexts with which the student is familiar) and its openness
(the number of possible solution methods available to the student).
These factors interact in unpredictable ways, and it is therefore not
possible to predict the overall difficulty posed by a task. This may
only be achieved by pre-testing the task with a sample of students.
It is now recognized that there is often a gap of several
years between being able to perform a skill imitatively in a
familiar context and being able to deploy that skill, perhaps in
conjunction with other skills, autonomously in a non-routine
situation. Tasks that require a high degree of autonomy and
flexibility will need to contain lower technical demand if they are
to be accessible to most students.
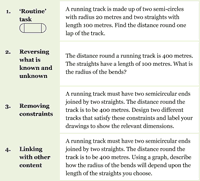
Task designers can thus deliberately reduce or increase task
difficulty in any given context. This may be done, for example, by
reversing what is known and unknown, by adding or removing
constraints or by drawing links with other content. Examples are
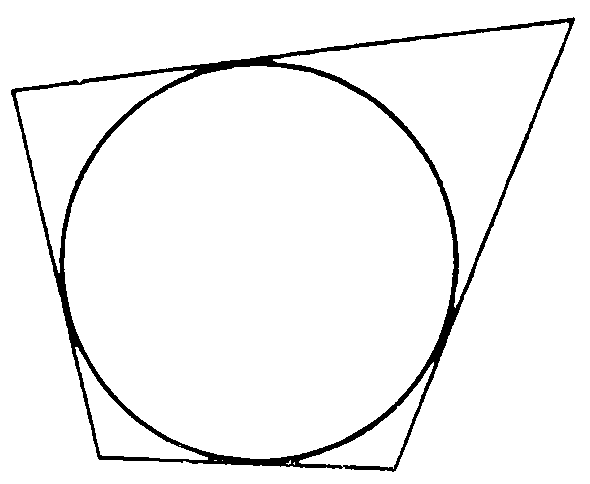
shown in Figure 5.
Scaffolding and transparency
3
A major design issue for task design is the level of
'scaffolding' within a task; that is the degree to which students are
led through the task, step-by-step. Task designers nearly always have
a model solution in mind. They then have to decide how far to guide
the student along their solution path. If they do this in a
step-by-step fashion, then clearly the task cannot assess
problem-solving strategies. If they leave the task 'open' to a wide
variety of responses, then students may be less clear as to the
expectations of the assessor. Thus there is often a tension between
the degree of scaffolding and transparency in the purpose of the
task.
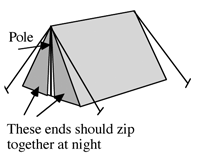
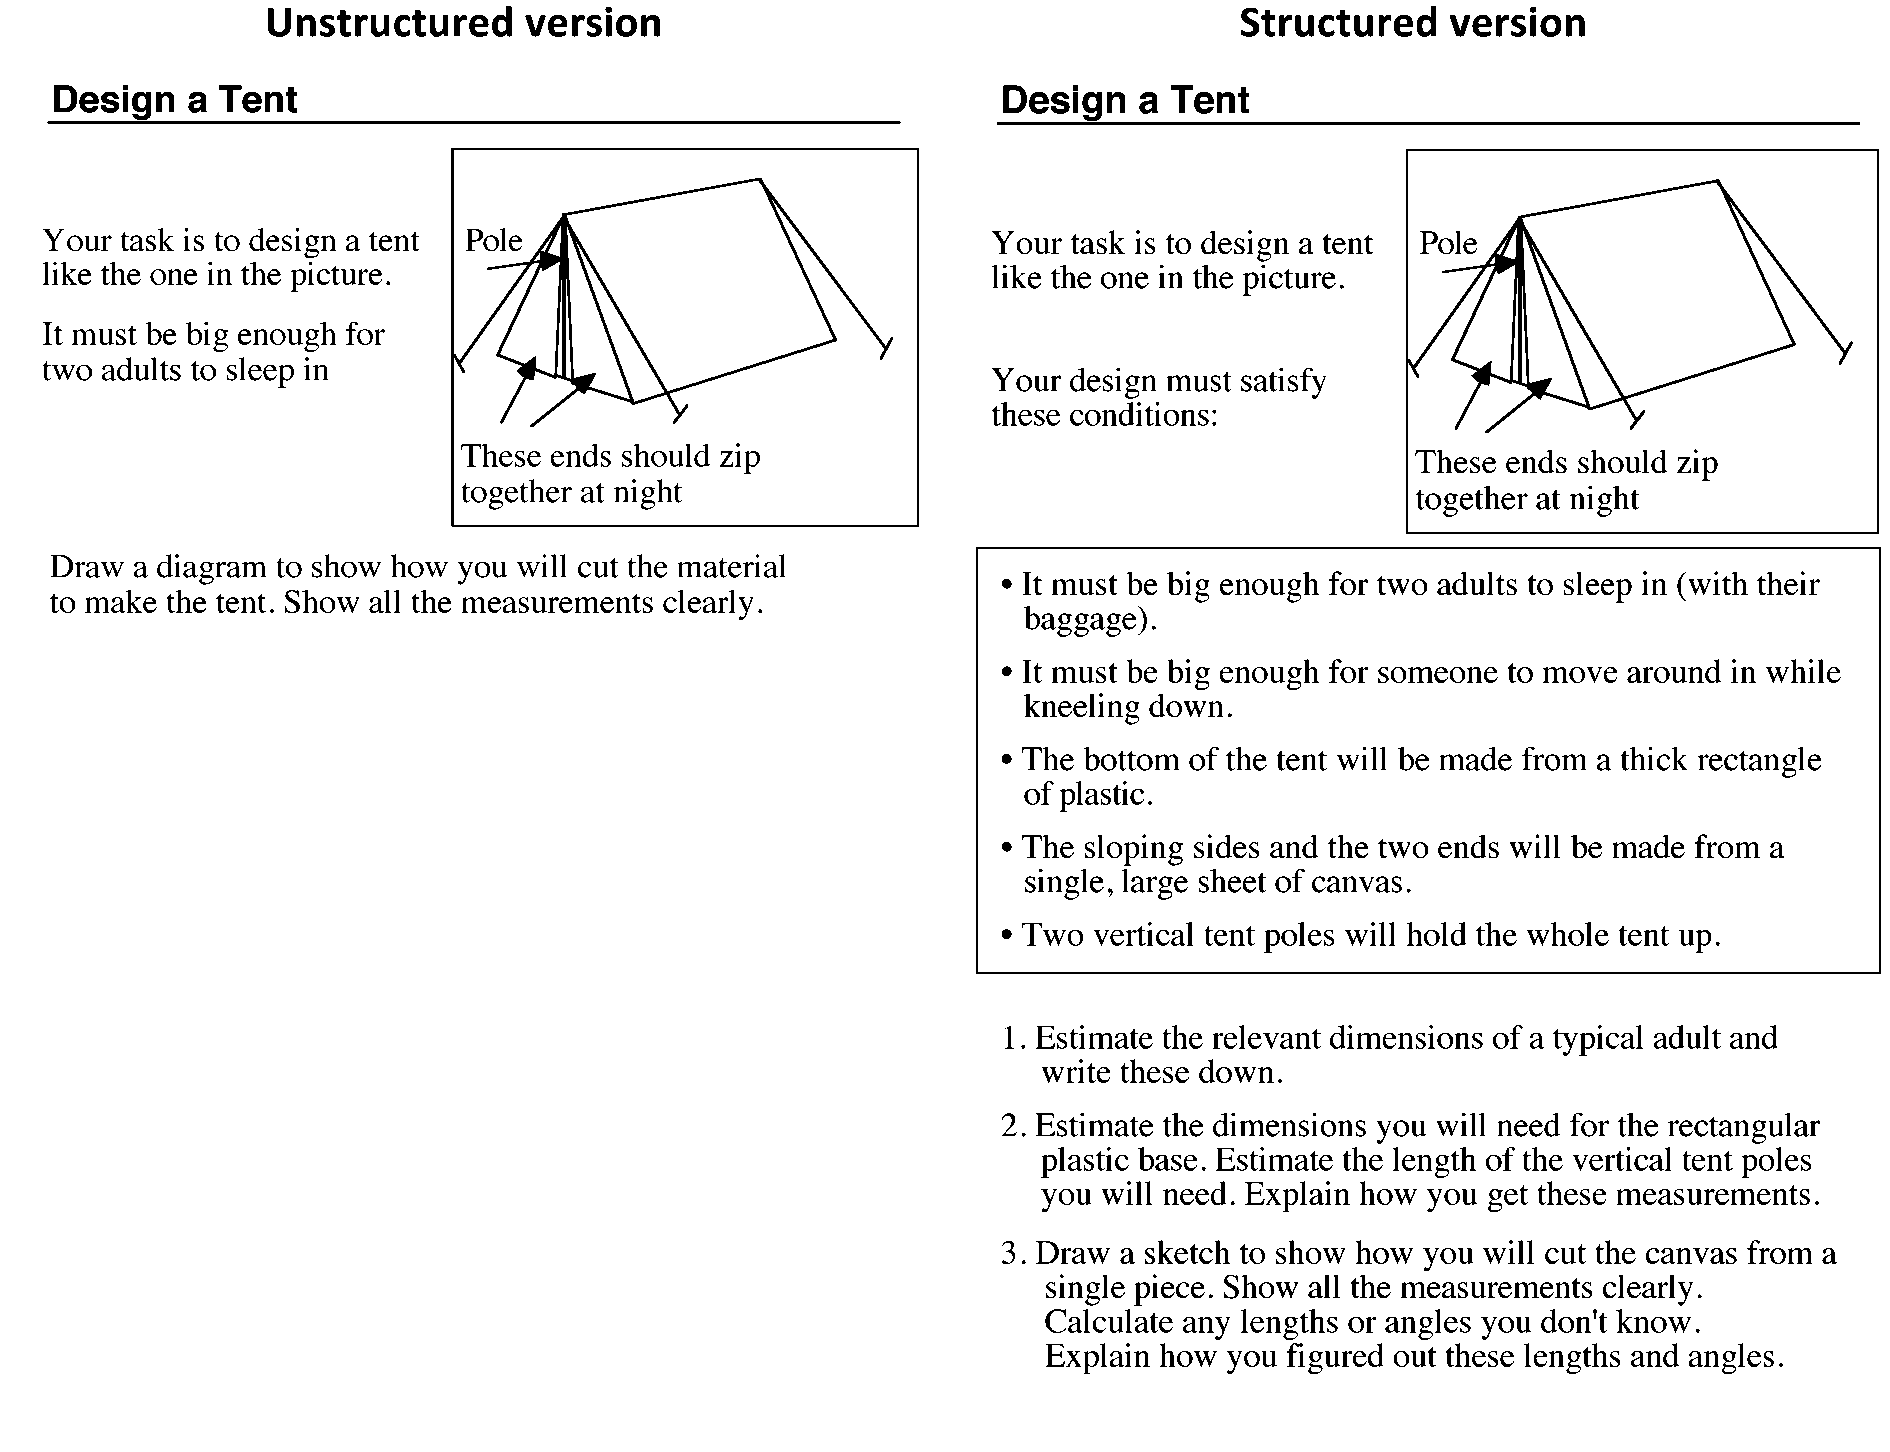
For example, in the ‘tent’ task (Figure 6) in which students are faced with
the problem of designing a tent, with a triangular cross-section,
for two adults to sleep in. The intended response is a drawing
showing how the material will be cut, labeled with suitable
dimensions.
In the less structured format, responses proved difficult to
assess, mainly because the task is ambiguous. Some students design
the tent from many pieces of material, while others use a single
piece. Some give unrealistic measurements and it is often
impossible to say whether this is because they cannot estimate the
dimensions of an adult, because they cannot transfer measurements
or because they cannot calculate accurately. Some make assumptions
that extra space is needed for baggage, but do not explicitly state
this. Some use trigonometry, others use Pythagoras' theorem, while
others use scale drawing.
With open tasks like this, students often interpret the task in
different ways, make different assumptions, and use different
mathematical techniques. In fact, they are essentially engaged in
different tasks. What is more, it is not always possible to
infer their interpretations, assumptions and abilities from the
written responses. If students have not used Pythagoras' theorem, for
example, we cannot tell if it is because they are unable to use it,
or simply have chosen not to. This argument may also be applied to
mathematical processes. How can we assess whether or not a student
can generalize a pattern or validate a solution unless we ask them
to?
One solution to the scaffolding/transparency issue is to clearly
define the specific assessment purposes of a package of
tasks, making clear what will be valued – a kind of general rubric. They then know the
assessment objectives for the collection, but are not told in a
particular task that they should use algebra on this particular
occasion.
Returning to the tent example, we decided to incorporate more
guidance in the task itself (Figure
6). There are now clear instructions to estimate, calculate and
explain. This enables the assessor to follow through calculations and
reasoning. Notice that students are still not explicitly told to use
Pythagoras' theorem or trigonometry and a significant degree of
problem solving is retained.
To achieve rich and robust assessment, tasks are tried and revised
many times, exploring alternative degrees of scaffolding. In one
study, two versions of the same task were compared, one structured
and one unstructured (Shannon
1999; Shannon &
Zawojewski 1995).
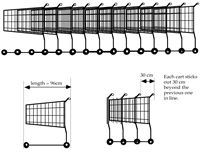
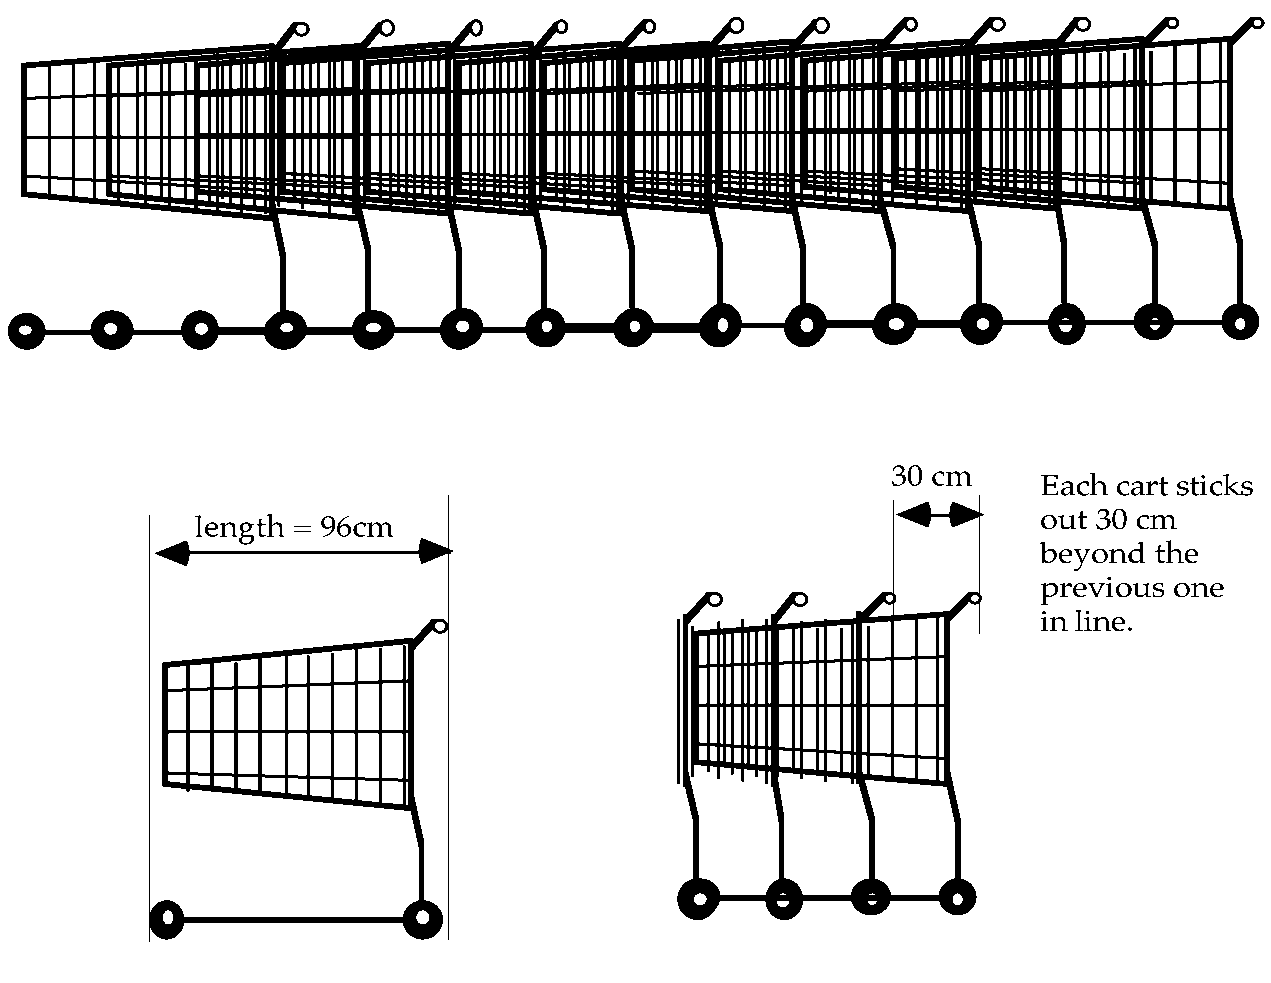
The task, shown in Figure 7,
required students to find a general rule for the total length of a
nested stack of supermarket carts, when one knows the length of a
single cart and the amount each subsequent cart protrudes. The task
was scaffolded by a series of questions gently ramped in order of
difficulty, starting from specific examples to a final, generalized
'challenge'. The unstructured version just gave a statement of the
generalized problem. This study found, as one would expect, that
students struggled more with the less structured version and fewer
were able to arrive at the general solution. What was perhaps more
interesting was that the students perceived the purposes
of the tasks as qualitatively different. The students saw the
structured task as assessing content related to equations or
functions, while they saw the unstructured task as assessing how
they would develop an approach to a problem. Students had
no suggestions as to how the structured task could be improved, but
they had many suggestions as to how the unstructured task could be
made to give clearer guidance. Although they could identify the
distinct purposes behind the tasks, they assigned their
difficulties to poor task design rather than their own lack of
experience of tackling unstructured problems. This result
emphasizes the importance of the need for adequately supportive
teaching materials and professional development that enable
teachers to meet the new challenges of unstructured tasks.
Context and authenticity
4
It is helpful to consider three categories of context for rich tasks
(Swan 1993):
- Pure mathematical tasks, where the focus of
attention is on the exploration of the structure of mathematics
itself.
- Authentic tasks. This category is different in that
the focus of attention is on gaining new insights into the world
outside mathematics. Such tasks require the integration and
deployment of mathematical and non-mathematical skills; they may
contain superfluous or insufficient information and their solutions
are often of real practical value.
- Illustrative applications which illustrate the use
of mathematical ideas. Here the focus of the task is still on a
mathematical idea, but it is embodied in a realistic (or
pseudo-realistic) application. The intention is primarily to assess
facility and understanding of mathematics, not to develop insights
into the real world; however, it also assesses knowledge of standard
models, which is an important part of active modeling.
In recent years there has been a change in emphasis in high stakes
examinations towards an increasing use of applications of
mathematics. In practice, however, many of these have been
cosmetic, illustrative applications that distort or obscure the
mathematical intentions. A contextual ‘game’ is played with
students who need socializing into its ‘rules’ in order to make
sense of the questions and the kinds of answers that are expected.
Examples of this are cited in Cooper
and Dunne (2000) in their analysis of the national curriculum test
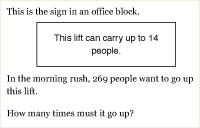
items in England. Consider first the following problem (Figure 8):
This problem was designed to assess a single criterion from the
curriculum, (and as such serves as a prime example of the tendency to
cover the curriculum fragment by fragment). The criterion is: Can
solve problems with the aid of a calculator and interpret the
display. ‘Appropriate evidence’ for success was stated as: ‘Gives
the answer to the division of 269 by 14 as 20, indicating that they
have interpreted the calculator display to select the appropriate
whole number, do not accept 19 or 19.2’.
This task thus requires students to interpret their answers in
contextual terms. As Cooper
and Dunne (2000, p. 35) point out, the student must introduce just
enough realism (only whole numbers of journeys are permitted) but
not too much (the lift might not always be full; some people may
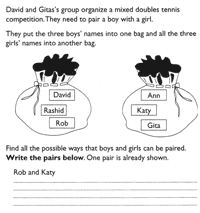
require more than the average space). The Tennis problem (Figure 9) illustrates further
difficulties when the context is taken too seriously. This was
designed to assess the criterion: Can identify all the
outcomes of combining two independent events. It was found that
some students imagined the physical act of drawing out names from
the bags in a commonsense way. One student began the task by
imagining their hand going to ‘the bottom’ of the left hand bag and
drawing out Rob’s name. They then went ‘half way down’ the right
hand bag and drew out Katy’s name. This student was thus treating
the pictures as physical bags. The chosen names were imagined to be
‘removed’ from the bags and the next pair was chosen. Only three
pairs were thus obtained instead of the intended nine. This
student, when prompted by an interviewer, could satisfy the
criterion, but did not recognize the contextual ‘game’ that was
being played here.
Intriguingly, Cooper and Dunne also found that students from
different social backgrounds tended to interpret illustrative
applications in different ways. The working class students tended to
respond initially in a more inappropriately ‘realistic manner’, but
when prompted to reconsider, corrected their response. The
‘service-class’ children, however, responded in a more ‘esoteric
manner’. For such reasons, an inappropriate context can introduce a
cultural bias into an examination.
The use of authentic tasks is uncommon in Mathematics examinations.
In such cases the student is less likely to be disadvantaged by
taking the context seriously, in fact they may be actively
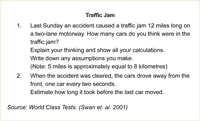
encouraged to do so. In the following example (Figure 10) the purpose of the task is to
assess whether or not a student can make sensible assumptions and
approximations, then work logically towards a reasonable estimate
in an everyday context. In such a task, the scoring scheme must be
flexible, allowing credit for different, but valid, assumptions and
approaches.
Language and layout
5
Careful task designers will take great care over the language and
layout of tasks. This is a lesson that has been learned by most
awarding bodies in England, who now employ consultants that address
readability issues. It is recognized, for example, that using a sans-serif
font, writing in
the present tense, keeping sentences short and starting each sentence
on a new line, all improve readability. It is also unhelpful to ask
more than one question on each line, otherwise some students have a
tendency to answer the first but miss the second. Wording can also be
clarified by visual strategies, such as using speech bubbles or
tables.
The “Movie Club” (Figure
11a) is a draft task proposed by one designer for an examination
in the US. When the task was piloted with students, it was found
that some students had great difficulty in understanding the
context and the language.
Students interpreted the notion of movie club membership in
different ways, drawing on their own personal experiences. Some
assumed that the membership runs out as movie tickets are bought.
Others assumed that one could buy a card entitling the holder to
see a given number of movies at a reduced rate only up to the value
of the card. The presentation of the task also caused unnecessary
difficulty, particularly the sentence structure in the second part.
The revised version (Figure
11b) was proposed in the light of discussions with designers and
proved to be more accessible to students, without changing the
intended assessment objectives. In this version accessibility and
clarity are increased by: introducing the simpler case of Omar
first; keeping sentences shorter, clearer and in the present tense;
making it clear that the card costs $15 and that the membership is
not used up; making it clear that Hector is saving money in the
long run. Students are now explicitly asked to show their
reasoning.
Efficiency
6
Examination time is at a premium and a designer must seek to use
this time efficiently to allow students to demonstrate a range of
performance. Tasks that require repetitive calculations or
strategies may need to be avoided. The task “greatest product” (Figure 12) is also an
example of this. While this task does assess the student’s capacity
to use a calculator to search systematically for a solution to a
pure optimization problem, the time this task requires may be
disproportionate to its value in the context of a timed, written
examination. (Other task examples in this paper aim to avoid this
trap.)
Accessibility and differentiation
7
An ideal examination will allow all students that take it to show
what they know, understand and can do (Cockcroft 1982), without wasting examination
time in ‘failure activity’. This is perhaps more difficult in mathematics
examinations than in the humanities, where “differentiation by
outcome only” is standard practice; essay questions allow students to
respond at their own levels. Less structured tasks in mathematics
also have this property; we have discussed their drawbacks above.
The “exponential ramp” is a powerful design technique for assessing
a wide range of levels of performance of students. Ramping can
occur over complete papers, where tasks get gradually more
demanding. This is often used when the tasks themselves are short.
Problem solving assessment, however is better served by rich
substantial tasks that are individually designed to offer ‘low
entry, high ceiling’ demands. Thus the examination becomes a series
of ramped challenges. Figure
13 offers an example of a task with a severe ramp in difficulty
for 16 year-old students. The entry is very straightforward, while
part 4 is extremely challenging.
A common design flaw is to produce a task where the ramp of
difficulty is unintentionally inverted. That is where the early
part of a task is more demanding than a later part. This will
result in students omitting much of the task even though it may be
accessible to them.
As we have seen, there are losses as well as gains from scaffolding
and ramping; here it means that students only have to answer
questions, not pose them. However, leaving tasks too open can make
them frightening and inaccessible. The task in Figure 14 was set over fifty years ago in a
high stakes examination (for 16 year old students) and the
examiner’s comments are still pertinent today:
There are always questions nobody wants to answer and this was
one of those. One regrets afterwards having set it, and wonders why
no-one attempted it, and what anyone would have said if they had!
The difficulties of choosing the right sort of question will have
become apparent. There must be enough scope for both discovery and
invention; enough of trivialities to make a start possible, but not
so many that the whole thing becomes insipid; enough of the familiar
to give confidence, but enough of the unfamiliar to give a
challenge. (Fielker 1968,
p. 69)
The use of ramped, rich, tasks that differentiate by outcome
can obviate or reduce the need for differentiated or ’tiered’
examination papers, where different students are given more or less
challenging tasks according to their expected level of performance.
In the US, tiers are unacceptable for valid social reasons – that
potentially high-achieving students from less-advantaged backgrounds
are placed in classes where there are lower expectations. This is not
given the same priority in England, where it is argued that students
should be given tasks that enable them to show what they can do – not
what they cannot. This is an important and interesting dilemma.
7. Evaluating performance
7
All assessment involves value judgment. The choice of task types
defines the range of performances that are valued. Scoring
schemes define how far the various elements of performance on a task
are valued. Thus scoring, aggregating points and reporting on
achievement are major issues in assessment design. Here we shall look
at scoring problem solving tasks from a broader perspective than is
common in UK mathematics assessment.
First we note that the value system is often distorted by the
perceived constraints of practicality. Scoring schemes in
Mathematics, instead of apportioning credit according to the
importance of the elements of performance in the task, often assign
points to elements that are easy to identify – for example answers
rather than explanations. Tasks are often chosen because they are
“easy to score”, and eliminated if scoring may involve judgment.
While any high-stakes assessment system must work smoothly in
practice, experience in other subjects suggests that many of the
constraints that are accepted for Mathematics are unnecessary. We
discuss these further in Section 9, Designing an assessment
system: myths and reality.
Point-based scoring
1
In England, traditional scoring schemes are of the point-based type
such as that shown in Figure
15. The total points available are chosen to be equal to the
length of time (in minutes) it takes a typical successful student
to complete the task. This arbitrary choice balances two needs: for
precision and for avoiding overloading examiners’ judgments with
too much detail. The total points for each task are then
distributed among the different aspects of performance, ideally so
that each aspect is given a weight appropriate to its importance.
The points awarded are coded here as M, A and E, according to
whether they are for Method, Accuracy (usually awarded
only when following a correct method), or Explanation. The
√ symbol is used to indicate that the point may also be gained by
correctly following through an incorrect result from the previous
part.
This approach to scoring must be comprehensive enough to cover every
possible approach to the task, and reliability is clearly enhanced when the task is
highly structured, as here. Most high stakes assessment tasks are not
pre-trialled, for perceived security and cost reasons, and this means
that scoring schemes cannot be completely determined beforehand.
Adjustments are made and circulated as sample scripts become
available. Scoring schemes for problem solving tasks, where many
solution methods are possible may also be of a point-based type, but
clearly they will tend to be longer and contain more conditional
statements. The advantages of point-based scoring schemes are that
they are highly specific and easy to implement, requiring relatively
little training to achieve a given accuracy of scoring and are simple
to aggregate and statistically stable (small changes in input
judgements have only small changes on outcome measures). Their
disadvantage is that, being task-based, they do not link directly to
any absolute standards of performance.
Holistic criterion-based scoring.
2
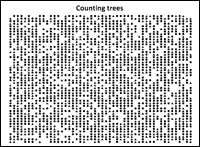
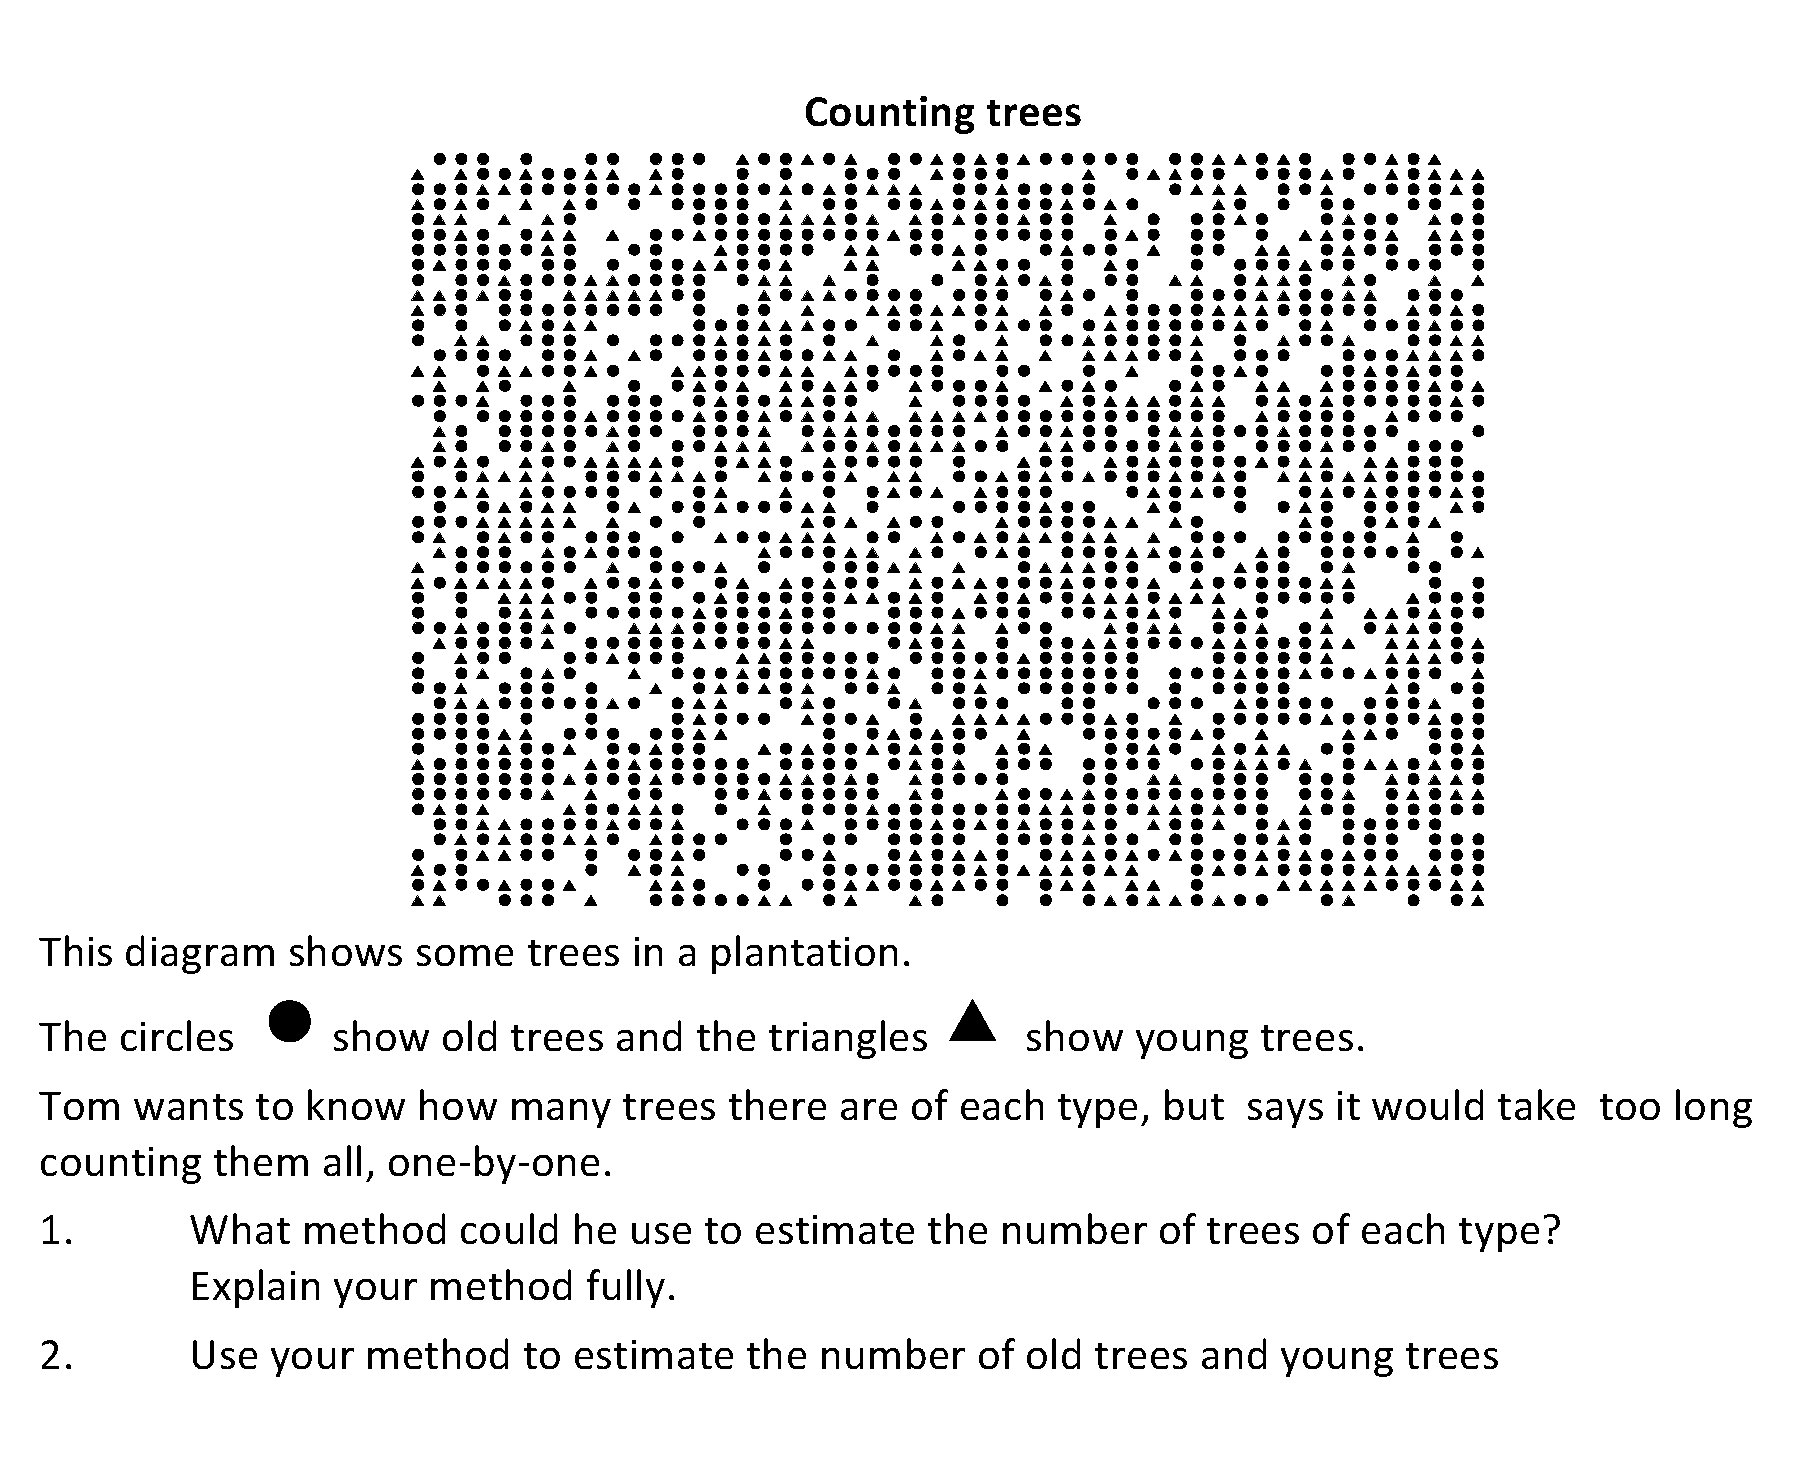
Figure 16 shows Counting
Trees, a problem-solving task designed for students aged 13-14.
This task was designed to assess four elements of performance:
- Simplify and represent: Students simplify a
complex situation and choose an appropriate method to use to count
the trees.
- Analyze and solve: Students use a method of
sampling to estimate the numbers in the whole plantation. They may
also use the relative proportions of the two kinds of trees.
- Interpret and evaluate: Students consider the
accuracy of their results.
- Communicate and reflect: Students communicate
their method clearly.
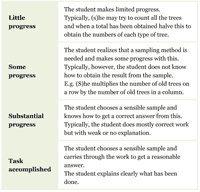
A simple four-level holistic scoring rubric is shown in Figure 17. Here the assessor
must read through and absorb the whole response and make a direct
judgement on its level, guided by descriptions of each level of
performance which are in turn exemplified by carefully selected
samples of student work. This approach to scoring is more directly
related to the elements of performance and is much more useful for
formative assessment. Scores may be aggregated if they are turned
into numerical levels and added, but clearly the scoring process
will tend to be more subjective.
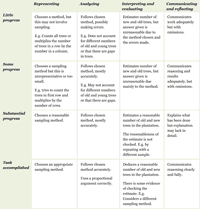
Analytic criterion-based scoring
3
This approach is based on more detailed assessment grids (see Figure 18) that describe
levels of performance on each process element of performance. The
assessor again looks for the description that most closely
resembles elements in the student response. This approach leads to
a finer grain judgment and is most helpful in communicating to
teachers the value system of the assessment. It is thus likely to
have the most beneficial backwash effect on the curriculum.
Adaptive Comparative Judgments
4
A key barrier to the widespread assessment of problem-solving
processes and practices is that, compared to straightforward
calculations, they are difficult to assess with high inter-rater
reliability (Laming 1990).
One needs to assess those aspects of performance that are highly
valued, yet if one does not assess these with sufficient reliability,
the measure itself is suspect (Laming
2004).
One approach to holistic scoring (that has only recently made
feasible by technology) is known as adaptive comparative
judgment (ACJ). This approach is not based on assessing against
absolute, benchmark performance criteria, but rather on assessors
making comparisons between pairs of student responses. When this is
repeated many times, with many assessors, it is possible to arrive at
a rank ordering of scripts with high reliability.
The theory behind this approach to rank ordering goes back to Thurstone (1927) who noted
that while people are poor at making absolute judgments of physical
properties, such as weights, they are much more adept at making
pairwise comparisons, such as “which of these two objects is
heavier?” Thurstone applied his method to develop psychological
scales for phenomena such as attitudes and social values (Thurstone 1954). More
recently examination providers have used the method to monitor
examination standards across time.
Until recently, comparative judgment has not been feasible for
anything but small studies and monitoring exercises involving only a
handful of student scripts. This is because n scripts involve (n2-n)/2
possible pairings so that, for a high-stakes system where many
thousands of scripts are to be rank ordered, many millions of
judgments would be required. Recently, algorithms have been devised
for selecting pairs progressively more efficiently; they use the
results of prior comparisons to focus on performances of similar
quality, dramatically reducing the number of comparisons needed. The process
involves a computer selecting and displaying pairs of
scripts to be compared as scoring proceeds, thus avoiding unnecessary
comparisons. Pollitt and
Murray (1996) have used this adaptive methodology to investigate,
among other things, how examiners assess spoken performances.
Early indications suggest that ACJ can be used to assess problem
solving with acceptably high reliability. It is still not as
consistent as traditional scoring methods in Mathematics, which can
have reliability >0.99; but in English, for example, reliability
is often between 0.9 to 0.95 (Newton
1996).
The resulting scores will be norm rather than criterion
referenced, but there is no reason why such an approach could not be
used year-on-year with standard responses seeded into the comparisons
to provide standardization.
8. Building tests from tasks
8
Apart from the design of tasks and scoring, there are many other
things that have to be got right to realise the potential that
excellence in the task set offers. These aspects are discussed in
some detail by the Working Group in a companion paper in this
issue (ISDDE, 2012). Here we
shall confine ourselves to making some points that are particularly
relevant to test design, working upwards in grain-size from tasks
through the construction of tests to the structure of the assessment
system as a whole. The Working Group visualised this process in three
stages:
- Creation of a pool of tasks
- Task selection and assembly of tests
- Delivery of tests, through to the production of reports
It points out the very different skills and responsibilities
each stage involves and recommends that different agencies be
responsible for them: design and development teams for creating the
tasks, a subject-based authoritative body for selection and assembly,
and a test-providing body for the large-scale handling of the testing
process. In this article, we have focused on assessment task design –
deliberately so, since the quality and variety of the tasks sets an
upper limit to the quality of any assessment system. We now turn our
attention to the second stage.
The assembly of tasks of different types and lengths into tests
is an often-contentious process that brings out differences in value
systems – hence the need for an authoritative body that can represent
society in the selection and balancing process. However, what is the
best relationship between such a body and the task designers? The
following strategies have been found to yield high quality tests. We
single these out here simply because current mathematics tests
clearly do not use them. Their essence is a two-step process,
separating the creative process of task design and development from
the analytical process of balancing tests.
Give the task designers an open brief to
design good tasks.
We have found that the most effective and admired tasks
emerge when a fine designer, who has already internalised the
content domain and the above principles of task design, is given
only broad guidance such as the range of process and content to
be covered and the characteristics of the target population. This
contrasts with the common practice of asking designers to produce
items that fit cells in an analytic domain matrix (a process that
guarantees mediocrity). Using several sources of tasks, designed
to a common brief, can give variety of challenge, and of
“flavour”. (In the humanities this variety is achieved by drawing
on the literature.)
Analyse tasks against the domain
framework.
When a collection of tasks has been generated, these are then
analysed against a framework to ensure an acceptable balance
across the various dimensions of performance in accordance with
the overall learning goals and constraints of time and
circumstance. One such Framework for Balance (MARS 1999) is offered in Figure 19. Weightings are
given within the different aspects of performance that each task
demands: content areas; phases of problem solving; task type;
openness and non-routine aspects; task and reasoning length.
Where imbalances are found, new tasks may be substituted. When
such a framework is not used, we find that only content areas are
balanced.
This approach thus uses to advantage the complementarity of
creative and analytic modes of thinking.
9. Designing an assessment system: myths and realities
9
Again, we shall not go over the ground covered in the Working
Group article but seek to bring out some points we believe to be
important.
Examination bodies are properly concerned with the
practicalities of their tests. They have a long list of reasons why
desirable things cannot be done. Some of these constraints are
unavoidable – for example, the total time available for testing will
have limits, as will the cost of equipment. But extensive experience
and evidence shows that other constraints are not as immovable as
they are sometimes perceived. The following three common myths
regarding assessment are often used to oppose the introduction of
problem solving into examinations.
Myth 1: Testing problem solving takes too much time.
1
Problem solving tasks that require decision-making and exploration
inevitably take longer to do than the straightforward exercises used
in most current examinations. This should not, however, lead to the
other extreme – the assumption that problem solving has to be
assessed through extended projects and portfolios. While this is
indeed possible, even perhaps desirable, this assumption has led (at
least in England) first to a separation between content and process
assessment, and then, to the rejection of the latter. Examination
bodies decided that curriculum content should be assessed through
timed, written papers, with problem solving and investigation
assessed through extended projects completed in classroom time
(‘coursework’). The assessment of the coursework was conducted by an
external agency, or by the teacher with external monitoring. Over
time, the coursework element became discredited for two reasons. The
first was the concern that the coursework element was not reflecting
the independent performance of students, evidenced by remarkable
similarities between many of the responses from some classes. The
second was that the problems set for the coursework were becoming
predictable and teachers were teaching to the test, again
contributing to inflated performances. Eventually, the coursework
element was dropped
and no high stakes assessment of mathematical practices is current in
England. The original planning of one of the US assessment consortia
had a similar structure – a computer-based adaptive test of short
items plus two days devoted to project tasks, assessed by the
teacher. Similar issues of credibility are bound to arise and,
recognizing this, the structure is being reconsidered.
We contest the assumption that tasks assessing mathematical processes
need to be of project length. While time constraints impose some
limits, there are many examples from high-stakes examinations around
the world using rich tasks in the 10-20 minute range that assess
problem solving, integrating processes and technical skills in a way
that is fair to students. One recent collection of such tasks may be
found in the Bowland Assessment materials (Bowland Maths 2008).
Myth 2: Each test should cover all the important mathematics;
problem solving would not permit this.
2
Mathematics is perhaps the only subject where there is a
tradition of “coverage”, assuming that all aspects of grade level
content should be assessed on every occasion. This has been at the
expense of any significant assessment of process aspects; once the
many dimensions of performance, including the interaction between
process and content in tasks, are recognized, it is clearly
impossible to assess the full range of possible performance. Is this
a concern? Sampling is accepted as the inevitable norm in all other
subjects. History examinations, year-by-year, ask for essays on
different aspects of the history curriculum; final examinations in
literature or poetry courses do not expect students to write about
every set book or poem studied. The same is true in science where,
for example “compare and contrast” tasks occur regularly but with
different pairs of compounds. It is accepted that a given examination
should: sample the domain of knowledge and performance; vary the
sample from year to year in an unpredictable way, so that teaching
addresses the whole domain; emphasise aspects that are of general
importance, notably the process aspects. The balance of the sampling
is however crucial, as discussed in the previous section.
Myth 3: Tests are precision instruments; problem solving
would make them less precise.
3
Tests are not precision instruments, as test-producers’ fine print
usually makes clear. Mathematics examiners have long been proud of
their ‘reliability’ - the consistency of scores when independent
examiners using the same scoring scheme assess the same collection of
responses. This does not necessarily mean that the test is an
accurate measure of what a student knows, understand and can do; that
must include the test-retest variation and, of course, a test that
samples across all the performance goals. Testing and then retesting
the same student on parallel examination papers, “equated” to the
same standard, should produce the same scores. In fact, the limited
evidence suggests that they are likely to be substantially different.
(There is a reluctance to publicise test-retest variation, or even to
measure it.) In the UK, Willmott
and Nuttall (1975) showed that about 25% of examinees may be
misclassified in ‘reliable’ 16+ examinations. Wiliam (2001) argued that 30-40% of students
are misclassified by the criterion-referenced levels arising from
National Curriculum tests. Gardner
and Cowan (2005), studying the high-stakes “eleven plus” test in
Northern Ireland, analysed the same students responses to two
“equivalent” tests; they found that the testing system had the
potential to misclassify up to two-thirds of the test-taking cohort
by as many as three grades. Recently, some detailed work on reliability
has been undertaken by OFQUAL (Baird
et al 2011). The potential for misclassification in any test,
however “reliable”, gave rise to the comment from Black et al. (2004) that rather than try to
assure the user that a parallel test would give the same result it
would be more realistic to accompany any result with a measure of the
expected variation. Policy makers ignore such uncertainty; they know
that this is not politically palatable when life-changing decisions
are made on the basis of supposedly - precise test scores. The
general public appears to have little understanding of statistical
variability (a challenge to mathematics education).
Some precision would be lost by introducing problem solving
tasks into a given examination; more time is needed to achieve
comparable precision with complex non-routine tasks. However, the
drive for “precision” has led to narrow de facto assessment
objectives and simplistic tests – to measuring the wrong things
because they are easy to assess. This is clearly pointless – the true
uncertainties remain high and the price paid from unbalanced
assessment is as unnecessary as it is harmful. Mathematics should be
content with reliability comparable with other subjects, notably
English, that command public confidence and respect. With the kinds
of approaches described in this paper, that is readily achievable.
10. Models of change
10
If the improvements to assessment outlined in this paper are to
become a reality, how can this be achieved? There are so many
examples of gross mismatch between the outcomes and the intentions of
sensible policy decisions that it is vital to recognize the scale of
the challenge. How best to do so is a huge subject; it is the focus
of the Working Group article in this volume. Here we shall content
ourselves with raising some issues and offering brief comments and
suggestions from a design perspective.
The development challenge we propose is
non-routine.
1
Some policy changes lie within the competence and expertise of those
most affected; these can safely be designed by practitioners and
implemented after piloting. Others lie outside the range of current
practice; these need a design-research approach, an empirical
development effort by experienced teams with a track record of
successful innovation. There is much more to say about the
methodological implications of tackling innovative design challenges.
Here we will only say that systematic research-based design and
development by several teams working in parallel to a common brief is
the approach most likely to yield high-quality outcomes. Even when the
innovation has been started, ongoing funding is needed to audit and
maintain the quality of new assessment tasks. The difficulty of
sustaining the design of high quality assessment is often overlooked.
Change by “incremental evolution”
2
When politicians identify a problem, there is usually an urge to
solve it quickly. Rapid imposed change, however, usually takes the
system beyond its capability for high-quality innovation. This leads
to cosmetic adaptation, where language and forms are
changed, but substance is not. An alternative, which we favour, is a
model of incremental evolution where units of assessment,
with supporting teaching and professional development materials, are
designed and developed in parallel. The pace of change can thus be adjusted to
the capability of the various elements of the system, particularly
teachers, to respond to the challenges that any innovation presents.
Such an approach has a much greater chance of success.
Examinations and systemic improvement
3
We end where we began, pointing out the central role of the
range, variety and balance of examination tasks in the learning
outcomes of any education system that has high-stakes testing. In
practice, the examinations set the upper limit on the learning that
is likely to be achieved in most classrooms. But they are only one
part of a high-quality assessment system concerned with learning;
reform by tests alone is a blunt instrument carrying risks of
failure.
Unless the innovations proposed here are well understood by teachers,
the changes will simply disorient many, which will not lead to
improved learning. Schools summatively test pupils every year, so we
need comparable quality in these tests, and in coursework
assessments. The failures we highlight under Myth 1 are not
inevitable (see e.g. Black et
al 2011). Successful coursework is commonplace in other subjects but
it needs to be well-engineered and supported. (The Australian and New
Zealand experience is that group moderation of student work by
teachers has proven an effective route to improvement, with a
positive backwash on teaching as a whole.)
All this has implications for the optimum balance of investment, of
time as well as of money, in different aspects of the system. Ongoing
investment in assessment design and development needs to be
increased; it supports all aspects of teaching and learning in a
highly cost-effective way. (It is a negligible proportion of the cost
of running the system.) A larger shift of resources is needed in the
investment of time for assessment activities in the classroom.
Student time spent in tackling rich tasks unaided is not just “test
preparation”, it is what doing mathematics is all about. Good
formative assessment builds on this approach, helping students to
critique and develop their solutions, and so improve their reasoning
– a topic to which we hope to turn in another issue of Educational
Designer.
Footnotes
ii
References
iii
Lew, H. C. (2008). Some characteristics in the Korean National
Curriculum and its revising process. In Z. Usiskin & E. Willmore
(Eds.), Mathematics Curriculum in Pacific Rim Countries:
China, Japan, Korea, Singapore. Mississippi. Information Age
Publishing.
Shell Centre (1984) Swan, M., Pitts, J., Fraser, R., Burkhardt, H.
and the Shell Centre team, Problems with Patterns and
Numbers, Manchester, U.K.: Joint Matriculation Board & Shell
Centre for Mathematical Education. http://www.nationalstemcentre.org.uk/elibrary/collection/161/red-and-blue-boxes.
Swan, M. (2008). Bowland Maths Professional development
resources.Online: http://www.bowlandmaths.org.uk.
Bowland Trust/ Department for Children, Schools and Families.