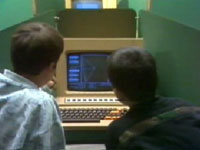
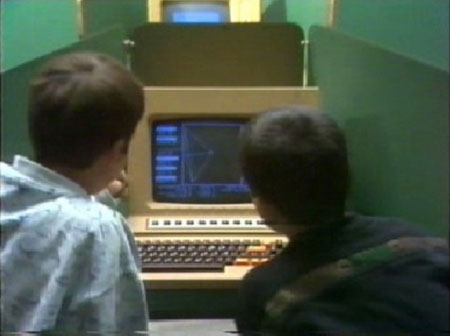
The short episode shown in Figure 1 with 5th graders learning about sub-families of quadrilaterals, involves a pair of students attempting to understand the properties of kites. They start with an observation of a specific example presented by the Geometric Supposer (the students were videotaped in 1991, working with an older version of the software, the first one designed in Hebrew to run on classroom computer mini-systems, long before personal computers made their appearance in schools). As they compare the properties of the kite with those of a familiar rhombus, they run into the issue of inclusion: the diagonals of the rhombus are perpendicular and bisect each other, whereas the diagonals of the kite are perpendicular and only one of the diagonals bisects the other. The students asked: “Could it be that a kite belongs to the rhombi or the rhombus is a kite?” This primitive conjecture then became a subject for inquiry.
A Designer Speaks: Michal Yerushalmy
Designing for Inquiry in School Mathematics
Abstract
iTeaching algebra for understanding requires a shift toward mathematical reasoning, away from merely memorizing procedures. To this end we developed a guided inquiry, technology-based algebra curriculum: Visual Math (LIR’OT MATEMATICA, in Hebrew, CET, 1995). The design of VisualMath is rooted in the philosophical stance in favor of mathematical reasoning and in socio-cultural pedagogical practices. I argue that in order to design for an inquiry curriculum in school mathematics, it is important to develop a perspective toward the subject matter and to design in a way that reflects this perspective.[1]
VisualMath applets
1This article contains links to online, working versions of some of the applets described. VisualMath applets require Microsoft Internet Explorer and may not run reliably in other browsers. You will also need the Java plug in (available from www.java.com). When you open the applets, you will be asked (possibly multiple times) to confirm that you want to run software downloaded from www.cet.ac.il.
1. Introduction
1VisualMath was designed to challenge traditional notions of what school mathematics is and how it can be taught and learned. For over two decades, this curriculum has been implemented in a variety of settings in Israel. As the product of academic laboratory development, VisualMath aims to address future innovations and analyze the potential of new technologies. Innovative resources were designed and incorporated at a time when personal technology, e-books, and mobile hardware were still in their infancy. Developing innovative instructional materials in an environment in which technology is continually changing carries the risk of allowing the technological aspirations to drive the design of the pedagogical engine. Schools in Israel as in the rest of the world have been undergoing educational reforms aimed at standardization of skills and centralization of assessment. Developing for these schools means coping with societal and curricular constraints that at times are in tension with innovative visions. In such an atmosphere charged with conflict, a clear view of the structure of the algebra that must be learned and of how traditional school-algebra content must be restructured served as an important anchor.
2. Challenge and Vision
2Our view of “doing mathematics” assumed the evolution of mathematical knowledge as a process centered on conjecturing. An important example that attracted the attention of philosophers of mathematics and educators (Hersh, 2006, Sriraman & English 2010) and affected our thinking was Lakatos’s essay Proofs and Refutations (1976). Lakatos presents a case study of inquiry guided by a teacher regarding Euler’s theorem, that challenges mathematical formalism in order “to elaborate the point that informal, quasi-empirical, mathematics does not grow through a monotonous increase of the number of theorems but the improvement of guesses by speculation and criticism” (p. 5). Lakatos did not intend to present a didactic situation. He used the situation of teacher, task, and students as “…a sort of rationally reconstructed or ‘distilled’ history” (p. 5). Lakatos’s philosophy of quasi-empirical development of mathematical concepts has been the subject for important philosophical debate (Hanna, 1996). Sriraman & English (ibid.) provide an extensive recent review of the influence of Lakatos’s work on the formats of constructivism in mathematics education. For over two decades concerns have been raised about the over-popularization of Lakatos’s work, and much criticism has been voiced about the blur between social constructions as a philosophy of mathematics and the pedagogy of social constructivism. Although the development of the Euler-Descartes theorem for polyhedrons is considered to be a unique case rather than representative of the development of mathematical theorems, the essay is known by “…the rich work of informal mathematics characterized by conjectures, failed proofs, thought experiments, examples and counter-examples etc.” (Sriraman & English ibid. p. 9). Lakatos provided what he characterized as a “simple pattern of mathematical discovery – or of the growth of informal mathematical theories” (p. 127), consisting of the following seven stages: (a) primitive conjecture; (b) proof (a rough thought, experiment, or argument); (c) conjecture and proof failed - global counter-examples to the primitive conjecture; (d) proof re-examined; (e) primitive conjecture improved; (f) other theorems examined to analyze the newly proved concept that “might be lying at the cross-roads of different proofs;” and (g) analyzing accepted consequences and turning counter-examples into examples of a new field of inquiry. The list of seven stages does not describe a linear progression but rather a series of repeated cycles of stages revisited. Lakatos’s informal construction of mathematics challenged my thinking about the learning and teaching of mathematics and affected directly Judah Schwartz’s and my attempts to design a learning environment and instructional materials that would support the guided inquiry in school mathematics. Our first challenge was to design a setting that would support Lakatos’s first required step, that of “[having a] primitive conjecture;” we wondered what could be regarded as “primitive” for young learners and could be developed to be considered important mathematics. By designing, developing, and studying the possibilities of including conjecturing into the core of the school geometry curriculum (Schwartz, 1995) we learn to appreciate the didactics based on conjecturing, which became feasible with the Geometric Supposer (Schwartz & Yerushalmy, 1985/2000). This work laid the foundation of the design of the VisualMath algebra curriculum. The following example demonstrates the common process of raising a naïve conjecture in classrooms of all ages working with the Geometric Supposer.
 Watch movie (needs Flash player)
A second challenge had to do with the quasi-empirical process of reasoning. We wondered what would motivate young students to argue, refute, and revise conjectures, and whether such prominent habits of mathematical reasoning can become part of the routine pedagogy of school mathematics. With the popularization of personal technology that can be used to easily provide examples, educators expected that data would naturally lead to inquiry. But observations would support what Lakatos had argued, namely that “Naive conjectures are not inductive conjectures: we arrive at them by trial and error, through conjectures and refutations. But if you — wrongly — believe that you arrived at them inductively from your tables, if you believe that the longer the table the more conjectures it will suggest, you may waste your time compiling unnecessary data” (1976, p. 74). Learners need scaffolding in order to perform a mathematical process that would elicit doubts and questions, and would create the motivation to look for patterns and to resolve the disagreements. To approach these pedagogical challenges, it was necessary to design learning settings in which principal concepts (shared by the mathematical philosophy of social construction), such as mathematical objects and actions, as well as methods of mathematical truth would become relevant issues of school mathematics. The scaffolding has taken a variety of shapes and occurred both in the mathematics class and as part of homework. Classroom settings include individual or pair work with activities for exploration and whole class discussions and are described in numerous articles that are beyond the scope of this paper . Here I wish to have a glimpse at the whole-group discussion to demonstrate conjecturing at the heart of routine guided inquiry. The three boards in Figure 2 document the end product of what amounts to a class period in which the teacher posed a problem and collected answers in the form of conjectures grown out of observations and argumentations.
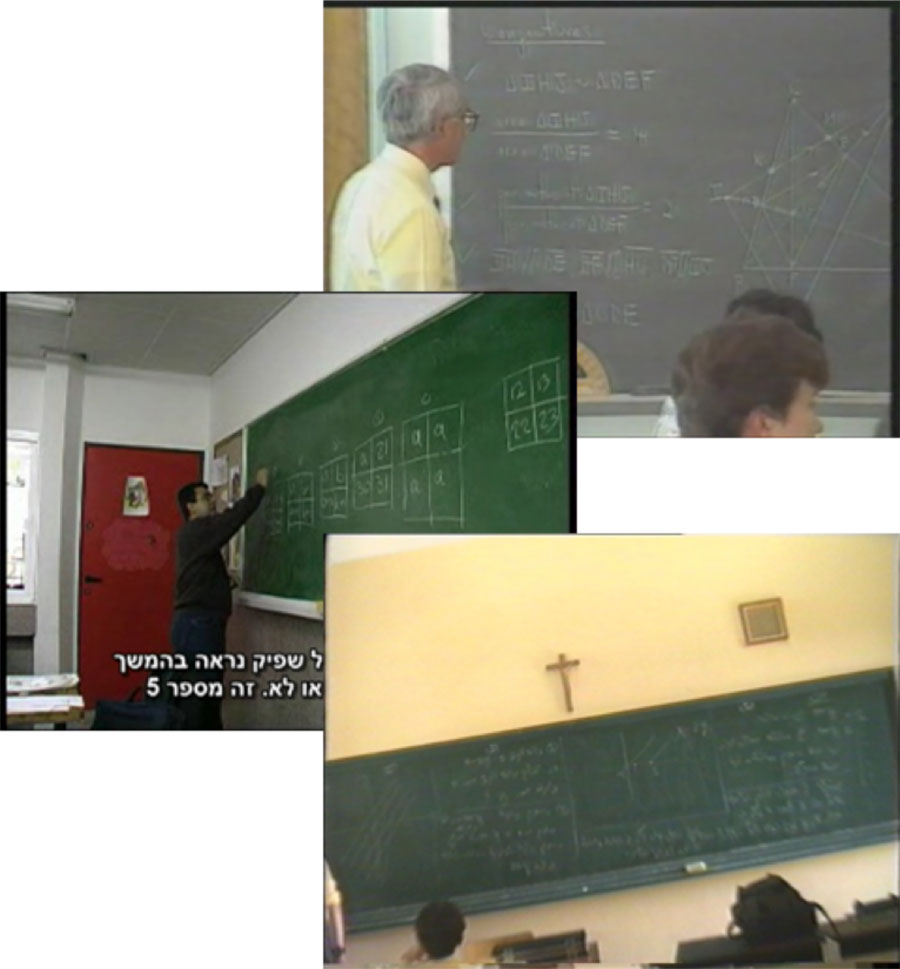
In the geometry class (Figure 2 top), students were given a construction and were asked to look for any interesting properties of it. They worked with the Geometric Supposer to formulate their conclusions, after which they were asked to reformulate them to make them fit a diagram and signs drawn by the teacher on the board. The teacher mainly documented the suggested solutions, then divided the long list into those that are agreed upon and can be proved and those that are not yet. The teacher then asked students to continue working on the less agreed ones. In the 7th grade beginners algebra class (Figure 2 middle), the only available manipulative was a sticky 10x10 board of the sequence 1 to 100, adjacent to the board. The teacher presented the task (“Describe a phenomenon relating the four numbers in any 2x2 section of the 10x10 board”) and asked for the students’ suggestions. He tried to limit his utterances to clarifications of the students’ language and intentions.
Some of the suggestions were based on preceding answers: refuting, agreeing, suggesting improvements, and at times suggesting a new idea. The records on the board were kept and presented as a topic for discussion that laid down the first ideas about the use of letters in algebra. In the 9th grade, with the introduction of two-variable equations (Figure 2 bottom), students looked for the representation of two-variable equations in the graph. They worked first in groups, some using paper and pencil, others brought in manipulatives. Next, the teacher asked each group to present its process of exploration and its conclusions to the class. During the presentations students managed the discussion, and the teacher, who did not interfere in the presentations, summarized all proposals on the board.
In each episode students suggested multiple solutions and nuances for the topic at hand. Feedback by classmates, and less frequently by the teacher, was based on the plausibility of the new idea in relation to known class mathematics. It was clear that the process was dependent on cultural and personal components and could have taken several other directions of construction in other groups or at some other time. And although complete freedom was granted in the statement of all three tasks, the conjectures were all related to the curriculum and considered part of the school learning occurring in institutions that adopted and developed specific practices, norms and visions regarding the meaning of knowing, learning and teaching.
A somewhat similar learning could occur in the course of guided visits to the exhibits of a museum. Similarly to a designed curriculum, a museum exhibit has an agenda presented by its curators: a view of the subject. The choices of objects, the relations between the objects, and the centrality of specific items (often a few important objects are presented in a way to focus the visitor’s attention) are all designed to reflect a certain view of the subject. An exhibit may be distributed over many galleries (at times taking place in parallel in a different museum), and many objects are presented in each gallery. As in the case of our envisioned algebra curriculum, it is often too demanding for visitors to explore all the galleries and they must choose where to go either by reading the map of the exhibit or by being guided to specific galleries. Interested visitors may want to come again and take the tour in a different order or visit the galleries they have not yet seen. Guidance, like teaching, can take the shape of a linear sequence charted by a tour guide. Another tour may follow a different sequence and change according to visitors’ interest. Yet another tour could be augmented by technology to provide information in a given order but also support direct access to objects of the visitors’ choice. Some museums could offer hands-on experience, supporting actions with content central to the exhibit. Thus, the museum exhibit is a designed space of relations between objects and between objects and viewers, which can support the development and understanding of ideas about the content and about the structure of a subject. We were looking for a representation of school algebra to guide our design of school learning and teaching
3. Designing a Representation of the Domain
3There is obvious tension between the specific order of teaching and learning along which the school curriculum proceeds, and the personal and social constructions of meaningful mathematics (Windschitl, 2002). Cognitive theories support curricula designed with the assumption that for most students the order marks a smooth progression. Tall (2002) provided examples showing that when learners in school need to reconstruct their knowledge in order to make progress, they may experience discontinuities in the curriculum. Tall argued that such discontinuities are inevitable and should be explored rather than avoided. Yerushalmy & Chazan (2008) used Tall’s construct of curricular discontinuities and examined how the introduction of technology potentially alters the nature of curricular discontinuities and how different technologies that can be used as educational tools for exploration can also be used by curriculum designers to alter the nature of the discontinuities that students face, without getting rid of them. Whether the divergence of learning opportunities is the result of a certain social-cultural philosophy, or of views concerning cognitive discontinuities, and even if they are altered to comply with the conditions of specific personal or innovative settings, curriculum developers are challenged to design a long-term sequence of instructional materials to help teachers respond to such critical curriculum developments. The design principles implemented in VisualMath attempted to respond to the challenge by adopting a view of the domain and representing it in a structure that is visible to its users, both learners and teachers.
Adopting a perspective
1The first design action in the representation of the domain was to adopt a perspective of the subject. Its underlying assumption is that school algebra is about functions and about structures. For the last two decades school algebra had been under severe criticism, and as a result it was subject to reform attempts. Several of these, including VisualMath, referred to as a “function approach to algebra”. Function-based approaches tend to avoid defining functions in a set theoretical manner, often proposes an early focus on covariation of quantities and emphasize relationships between the tabular, “algebraic,” and graphic representations of a function, at times with greater emphasis on sketches that capture relationships by taking advantage of graphing tools. This curricular change has led critics (such as Pimm, 1995) to argue that such approaches alter school algebra so drastically that it is no longer algebraic, because algebraic structures and skills became secondary to what was usually regarded as calculus approaches. In respond to this critic, VisualMath is designed to use functions as the foundation for mastering algebraic skills with understanding by all students.
Representing the structure
2The second design action in the representation of the domain was to organize the learning occasions in such a manner that would reflect the mathematical structure and the pedagogical routes that the subject offers.
In “Getting Students to Function in Algebra,” Schwartz (1992) described the learning occasions that any mathematical subject offers as actions that involve objects and operations: “Every mathematical ‘occasion’ is an occasion for attention to mathematical objects, the operations that can be carried out on and with those mathematical objects and the ‘meanings’ we wish to ascribe to those objects and those operations.” (p. 306) A given specific mathematical object will likely have specific operations that can be carried out on it - for example, shapes can be dilated, translated, rotated, sheared; functions can be transformed etc. We therefore prepared two lists. One consisted of the mathematical objects involved, in the form of types of functions that in symbolic structure are required by the traditional algebra syllabus, such as linear, quadratic or polynomial, exponential, rational, periodic. The other was a list of operations on and with the objects.
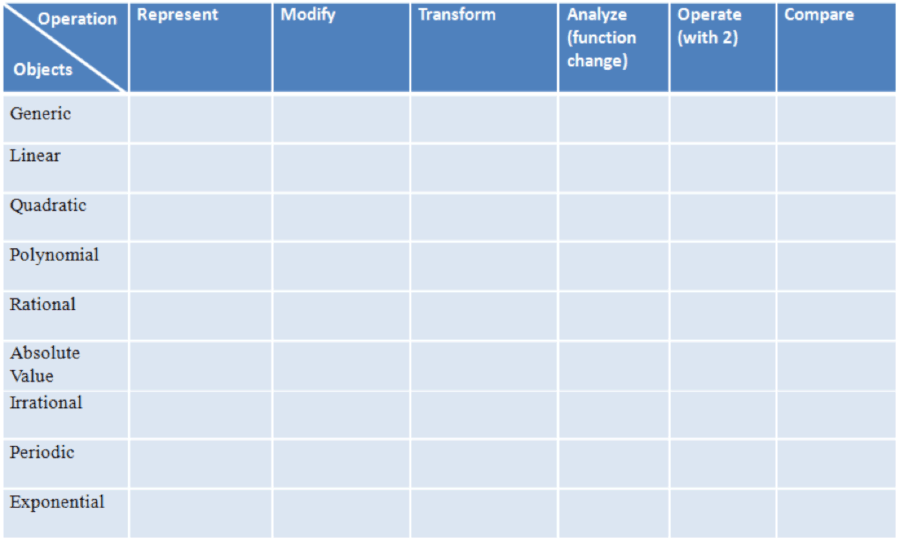
The six operations included do not form an exhaustive list. Rather, they are what Schwartz had called the “interesting middle:” (Schwartz, 1995) operations that are important mathematical concepts and are appropriate and useful to learn as part of function-based school algebra. The operations are: represent (a function), modify (reforming the view or structure without changing the function), transform (using operations to transform a function into families of functions), analyze the change of a function, operate with two functions (synthesizing new functions out of two different or identical functions), and compare two functions. The two lists are distinct, and were therefore placed in an orthogonal organization in a 2D matrix where each cell represents the opportunities for learning resulting from the corresponding operation and object. Each operation with an object can take place in symbolic, graphic, or numeric representations (Figure 3).
 Click
to enlarge
Click here to run
the Applet (Requres IE + Java)
Click
to enlarge
Click here to run
the Applet (Requres IE + Java)
 Click
to enlarge
Click here to run
the Applet (Requres IE + Java)
Click
to enlarge
Click here to run
the Applet (Requres IE + Java)
In most algebra curricula the study of the manipulation of expressions and of methods leading to solutions of equations are recognized as the central body of the required algebraic skills. In the map, one finds occasions to learn and master algebraic skills under four operations’ columns: Modify (change the function’s expression with a purpose), Transform, Operate (with two functions) and Compare two functions. The following examples from the VisualMath materials, together with references to our long-term research program, illustrate briefly how the objects & operations organization has been used to meet the traditional curricular requirements, to create occasions for learning algebraic skills with understanding, to challenge traditional views of the algebra and to outline the important mathematics that can be supported if different progression sequences are considered.
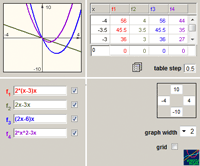
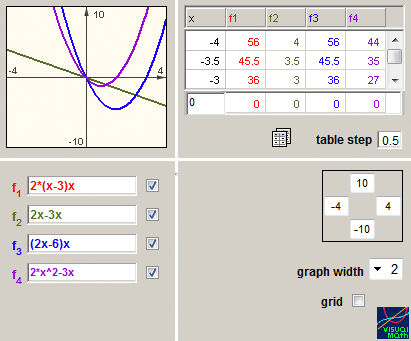
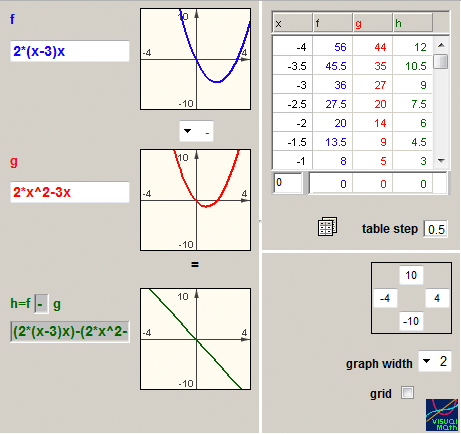
Manipulating expressions. When modifying expressions, one creates learning opportunities for the study of algebraic identities and of algebraic structures. In a linked multiple-representation setting, expression can be modified upon a direct transformation of its function graph. Symbolic skills would be required to analyze the action and the resulted modified expression. For example, a horizontal translation of the graph f(x) would result a new expression representing f(x+k). In the terminology of the function, Simplifying would mean restructuring an expression to produce equivalent expressions. It is the study of operating on the symbolic representation of a function in ways that do not change the function. In the VisualMath sequence simultaneous linked representations provide feedback about any change in the expressions. Figure 4a demonstrates three attempts to expand the given expression of the structure A(x-Bx)x. Two attempts (rows 2 and 4) are mistaken while the third one is correct although incomplete. The linear graph that represents the expression on row 2 is visually prompting an absence of the quadratic term. The parabola graph that represents the expression in row 4 suggests mistakes related to the quadratic or to the linear terms (or to both). The difference operation between two expressions would help to indicate more specifically the flaw in the operation that the non-equivalent expression (Figure 4b). Further examples of manipulations’ learning occasions and analysis of students’ practice can be found in Yerushalmy (1991), in Yerushalmy & Gafni (1992) and in Yerushalmy & Schwartz (1993).
Note: Unfortunately, the VisualMath applets were designed for Internet Explorer and will not run reliably in other browsers. You will also need the Java plug in (available from www.java.com). You will be asked (possibly multiple times) to confirm that you want to run software from www.cet.ac.il.
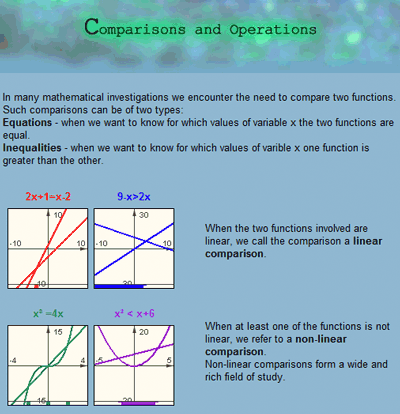
Solving equations
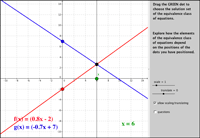
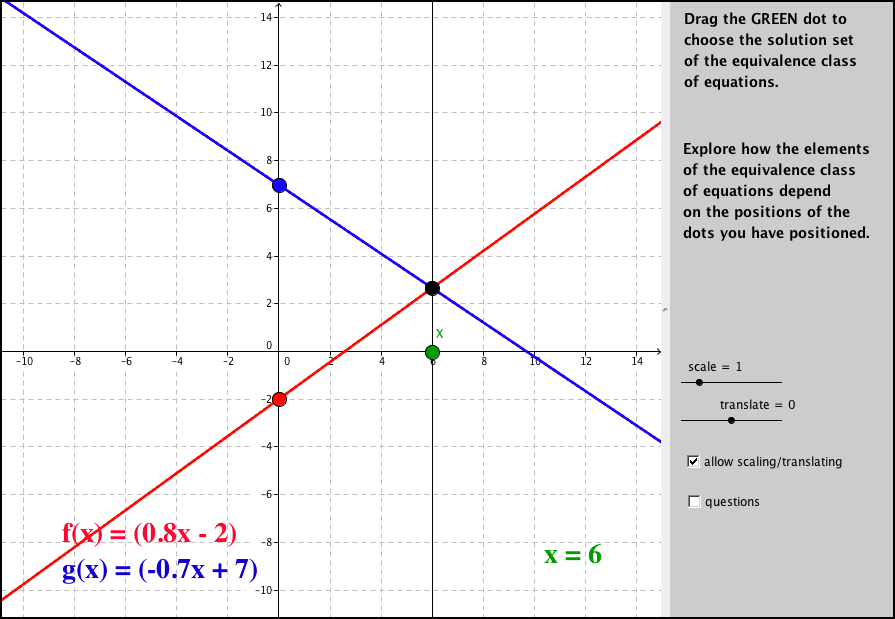
3Moving along the column of Comparing two functions one can design opportunities for learning equations and inequalities, and for learning equation’s solution methods. Solving an equation or inequality is viewed as a process in which the solver operates on the two compared expressions to produce equivalent equations. In the VisualMath approach the solution is the value of the variable for which each of the compared functions assumes the same output. Graphically, the representation of a solution is the intersection between the graphs of the two functions. This indication may act as feedback for the correctness of the symbolic operation, but we have found (Yerushalmy & Schwartz (1993).) that more important occasion for learning skills with understanding occur if the practice is part of a sequence that assumes a major role to functions and their graphs. For example, new ideas about the equivalence of equations could be observed and discussed naturally if symbol manipulations would occur in the context of transforming the graphs of the functions.
 Click to enlarge.
Click here to run
the applet (Requires Java)
Click to enlarge.
Click here to run
the applet (Requires Java)
Interacting with the UnSolving example in Figure 5 (Schwartz 2011) demonstrates it. Transformations (e.g., scaling, translation) of the graphs of given functions’ comparison are just another way to produce new equivalent comparisons. Transforming only one side of the equation and still keeping the solution is obvious when treating the solution as the intersection of two graphs, but quite surprising for all of us who learned that the only way to correctly arrive to solution is “to do the same” to both sides of the equation. The dynamic setting and the task were designed to raise primitive conjectures that then can be generalized and proved as part of learning and practicing symbols’ manipulations. Examples showing why such operations have a chance to create challenging mathematical inquiry in school algebra are analyzed in Chazan & Yerushalmy (2003).
Setting up learning occasions of this type represents a change of focus and possible change of order relative to the traditional assumption about algebraic skills being the foundation for the understanding of functions.
4 The Design of Tools: Creating the Inquiry Setting
4In reviewing the major challenges of adopting technology to support mathematics education many point to exaggerated technological expectations and ambiguous intentions about the roles of digital mathematical tools being two serious obstacles to current attempts to improve math education. Questioning the appropriate image of software tools has become a major component in transformational designs. We attempted to design “tools for learning mathematics” which is different from tools for “doing mathematics.” Tools for learning mathematics have a pedagogic agenda, which may be very limited or in the case of the some exploratory environments, quite broad and can be used in many ways in different settings. We envisioned tools that would allow inquiry as flexible as possible of and throughout as many as possible cells in the map in both representations’ layers. Thus, the role of the present section is showing why and how considerations related to the organization of representations, objects, and operations in the map directed our design of software tools for learning.
Designing tools for studying representation.
1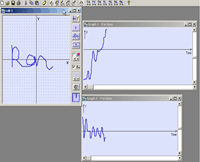
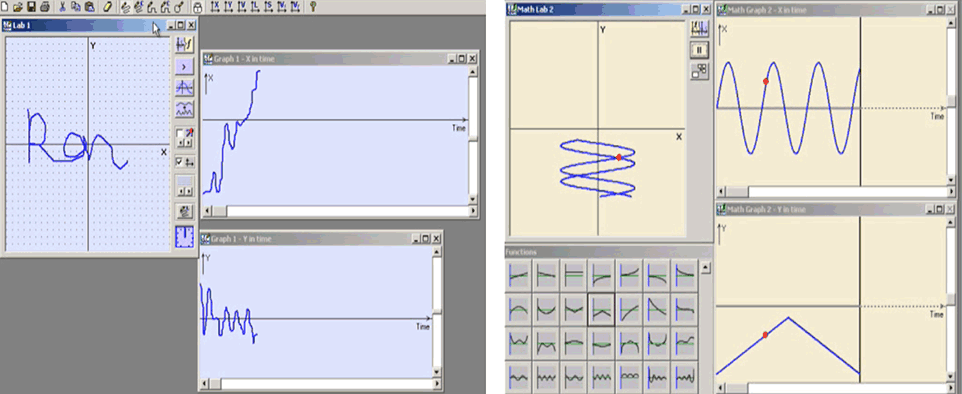
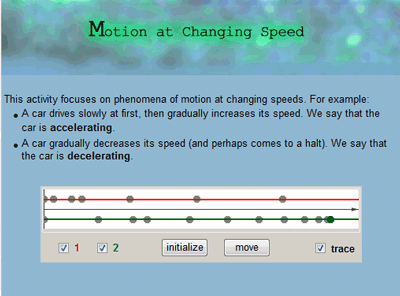
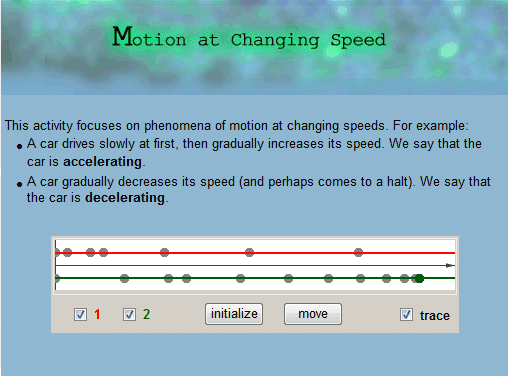
Considering the crucial role of understanding functions’ graphs for the learning of algebra structures and skills (demonstrated in Figure 4 and Figure 5), a central design challenge was to understand the affordances of technology and to design tools for operating graphically in ways that do not assume prior knowledge of algebraic symbols and skills. The design of the MoveOn! modeling microworld (Yerushalmy , Shternberg, Schwartz 2001) reflect this challenge. The microworld encourages the creation of functions’ graphs, the re-representation and analysis of graphs, the transformation and composition of graphs. Only graphs are provided to gradually explore and understand the major qualities of models of temporal phenomena: graphical presentation of time analysis of hand motion and motion synthesized of two functions’ graphs (x(t) and y(t) composed to y(x) as in Figure 6Figure 6). These types of graphs were designed to support a learning sequence that would normally start from body motion graphs, visual analysis of the motion traces, synthesizing visual signs (icons) to create a motion experiment and back to comparing the synthesized motion with the recorded hand motion. It was an important challenge of the design to scaffold the linkages within these types of representations.
Designing tools for studying an object
2Linear functions are usually selected as the starting point of algebra courses because the symbolic representation is relatively simple. Its simplicity, however, often leads to trivial design of instructional materials. Multiple interactively linked representations and direct manipulations of each of the representations that technology features, challenge this trivial image of the algebra of linear expressions. For example, the design of translation tools feature systematic change of symbolic expressions and of numerical values motivates the development of manipulation and reasoning skills that are required to prove the equivalence of the models Ax+C, D(x-B), and E(x-F)+G, and to propose the usefulness and generality of the model E(x-F)+G. The design of the difference operation tool described above (see Figure 4) challenged the notion that taking the function approach mistakes can be easily detected and observed but also analyzed and corrected. A constant function line (other than zero) indicates that a mistake may have occurred in the computation of free terms; a slope line indicates a mistaken result in the linear terms. The design of the comparison tools (as the one in Figure 5) in a way that allows fixating the point of intersection and graphically dragging one of the two lines, presented a challenge to the “mythical view of balance” whereby the solution of the equation remains true only if both sides change in the same way.
Designing tools for studying an operation
3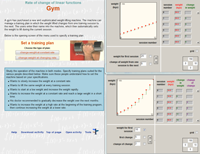 Click to enlarge
Click here to run
applet (requires IE+Java)
Click to enlarge
Click here to run
applet (requires IE+Java)
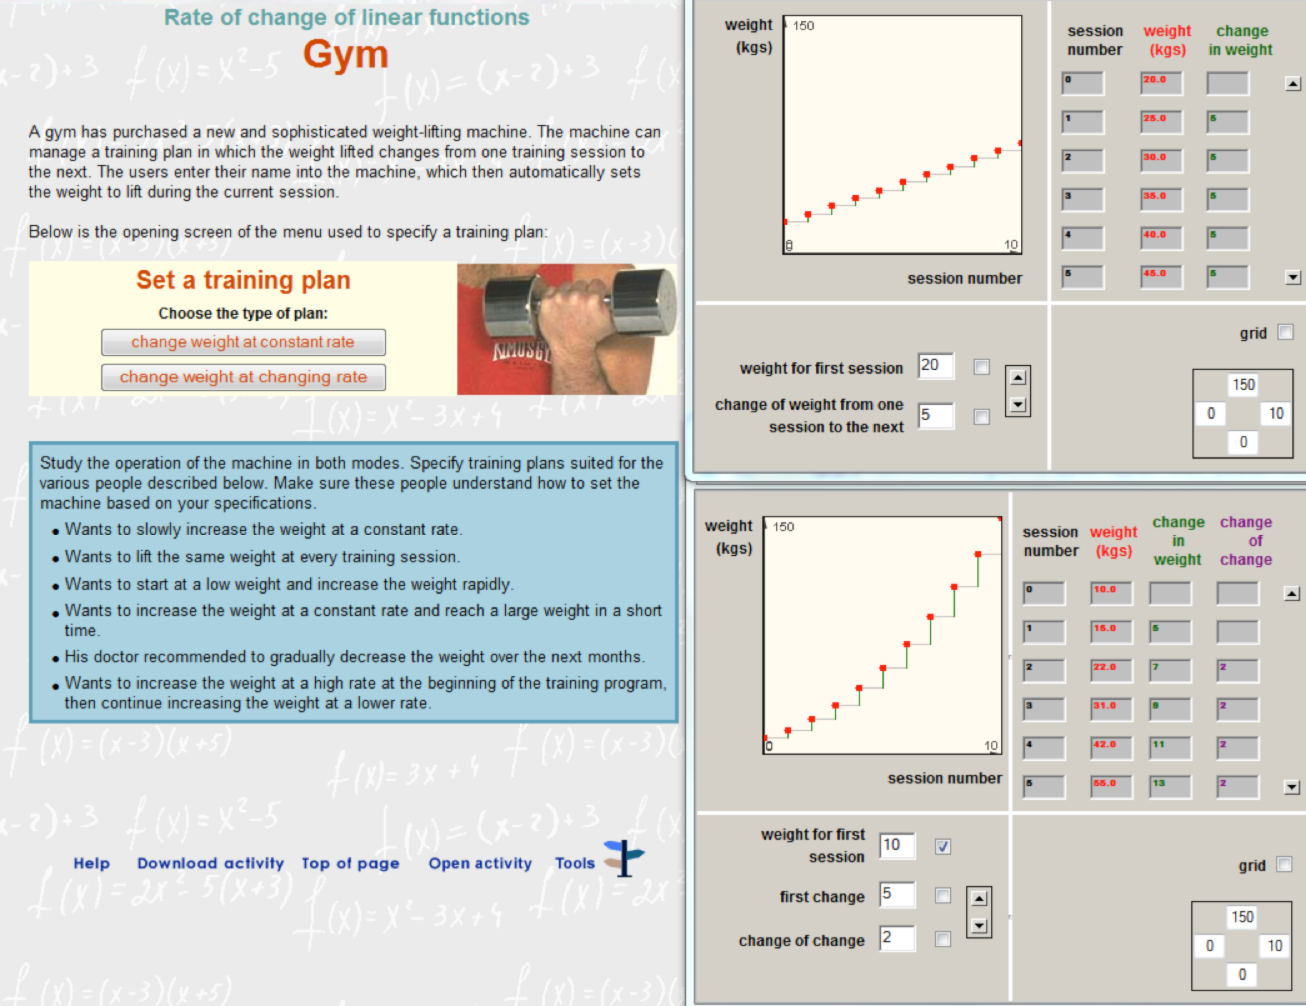
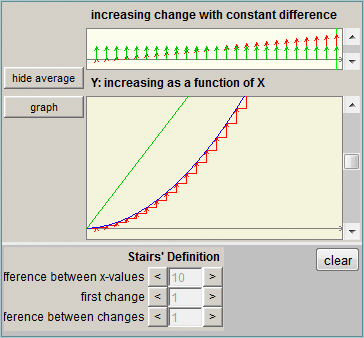
In the traditional algebra sequence, analyzing how a function changes is not a focus of attention, and it is treated mainly in calculus courses. In VisualMath an understanding of rate of change is assumed to be essential for understanding algebraic objects and operations in any representation. Therefore, the design had to challenge the assumption that rate of change is taught to students who completed algebra course and are skillful in symbolic manipulations. We developed tools for exploring rate of change based upon other familiar resources of the learner such as lexical descriptors ( e.g. increasing, decreasing, and constant) to describe a function and its inclination, visual objects as the “stair” that represented difference measured along a constant horizontal interval (delta x) and operations for analyzing differences numerically. These terms helped reduce stories to function-related language as a step in modeling and solving problems in context ()The various simulation tools and students’ learning are further described in Yerushalmy & Shternberg 2001, Shternberg & Yerushalmy 2003). The “stair” and the first and second differences which are part of the “Gym” interactive activity (Figure 7) have been studied by middle school students in order to generate and answer questions about the uniqueness of the linear function and expression. The same activity is studied by Calculus students familiar with the rules of derivatives but lack understanding of its meaning.
 Click here to run
applet (requires IE+Java)
Click here to run
applet (requires IE+Java)
In Yerushalmy (1999) I explained why achieving coherence between the educational vision and the tools is the most important reason for investing in the development of dedicated learning tools. Chazan (1999) pointed out that understanding the perspective upon which an instructional domain is organized is the greatest challenge for teachers. And in a different context, Jimmy Wales (2011, at Wikimania) pointed out that the worst problem faced by wiki is that the design of the tools does not reflect the norms of the wiki community. Indeed, the meta-design principle of visible coherence between the conceptual map of the subject and the pedagogy of mathematical inquiry has been our leading principle in designing the learning tools.
5. The Design of Tasks: Unpacking the Learning Occasions
5Another design challenge was to design learning sequences that can support the algebra class inquiry along the learning occasions identified in the map. Designing learning opportunities for the inquiry of linear, single-variable word problems in context illustrates the research and development process involved in the unpacking of an occasion (a cell in the map) and how it led to the design of tasks.
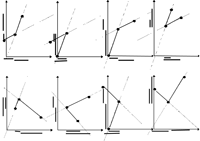
In the function approach, linear, single-variable problems in context are occasions created by comparing linear functions in multiple representations. Traditionally, the same problems are organized into a learning unit, ordered by the complexity of the equations to be manipulated and solved. The two views do not match exactly. Attempting to map this subject in a way that presents the view of the VisualMath mathematics we offered (Yerushalmy & Gilead 1999) a model consists of a representation of the mathematics of relations between linear functions. We identified eight main problem situations derived from this representation. Each represents two functions: f and g (Figure 8). The eight graphs differ structurally (in the inclination and the simultaneity of f and g) and found to challenge problem solvers with different cognitive complexities (Gilead & Yerushalmy, 2006). With some limitations, this organization allows the mapping of most linear word problems in algebra.

This mapping idea makes the design of the tasks for inquiry manageable because the number of problem types is reduced and ordering by complexity is based on the structure of the situations as represented by linear functions. The tasks involve practicing the required skills and provide opportunities that are mathematically interesting and manageable. On another level, the tasks are aimed at promoting the heuristics of problem solving (e.g., the study of the differences and similarities between problems) and strategies of inquiry (e.g., generalizations or counter-examples). Viewing the 8 problem situations sequence through dynamic lenses help to understand the mathematical similarity: linear transformation of scaling, translations and reflections (in horizontal or vertical lines) would turn a given model (one of the 8) to any of the other models. The technology acts here as a cognitive tool offering a way to experiment the generality of an example and its representativeness of the domain, and to learn similarity among problems and the solution strategies derived from that. Below is an example of a short learning sequence designed along this idea.
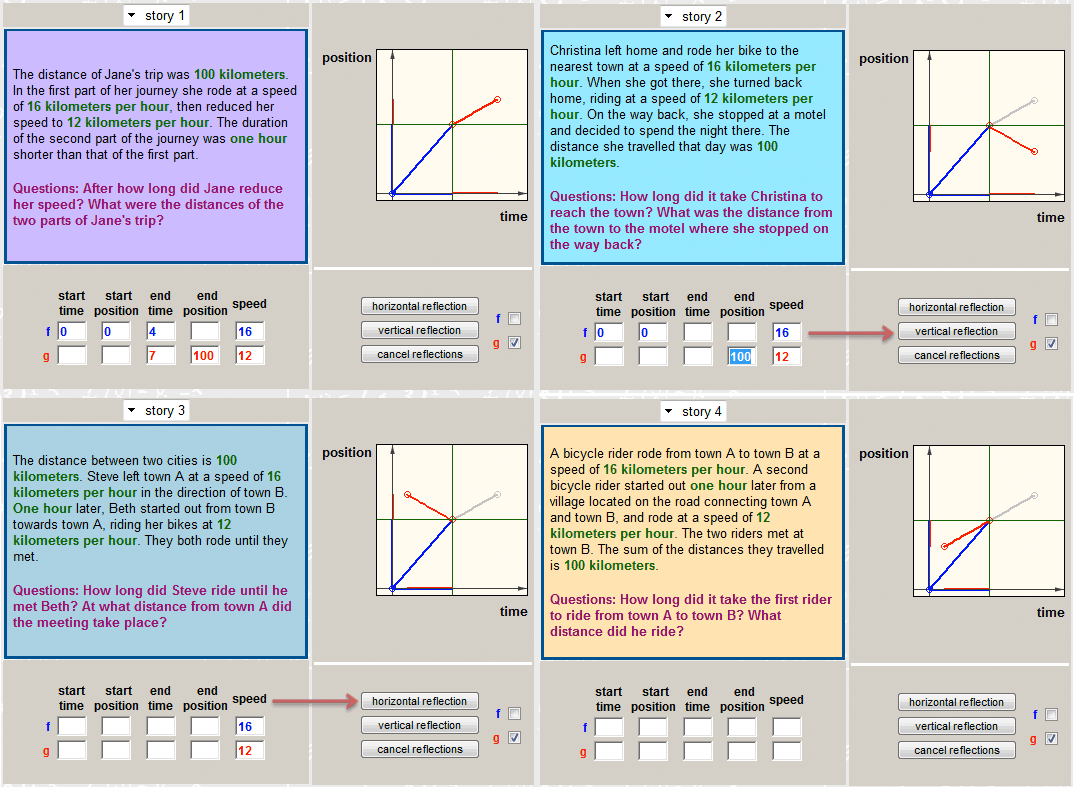
The following four story problems are similar to questions frequently found in algebra textbooks. It is most likely that the problems would appear in this order that represents increased complexity of the story details. It is also reasonable to assume that in a traditional algebra textbook each of the problems would present different numerical given quantities in order to provide further computational challenge.
| Problem 1: The distance of Jane's trip was 100 kilometers. In the first part of her journey she rode at a speed of 16 kilometers per hour, then reduced her speed to 12 kilometers per hour. The duration of the second part of the journey was one hour shorter than that of the first part. After how long did Jane reduce her speed? What were the distances of the two parts of Jane's trip? | Problem 2: Christina left home and rode her bike to the nearest town at a speed of 16 kilometers per hour. When she got there, she turned back home, riding at a speed of 12 kilometers per hour. On the way back, she stopped at a motel and decided to spend the night there, although she biked one hour less than she did in the morning. The distance she travelled that day was 100 kilometers. How long did it take Christina to reach the town? What was the distance from the town to the motel where she stopped on the way back? |
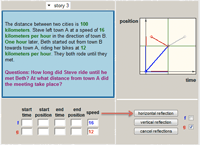
| Problem 3: The distance between two cities is 100 kilometers. Steve left town A at a speed of 16 kilometers per hour in the direction of town B. One hour later, Beth started out from town B toward town A, riding her bike at 12 kilometers per hour. They both rode until they met. How long did Steve ride until he met Beth? At what distance from town A did the meeting take place? | Problem 4: A bicycle rider rode from town A to town B at a speed of 16 kilometers per hour. A second bicycle rider started out one hour later from a village located on the road connecting town A and town B, and rode at a speed of 12 kilometers per hour. The two riders met at town B. The sum of the distances they travelled is 100 kilometers. How long did it take the first rider to ride from town A to town B? What distance did he ride? |
 Click to enlarge Click here to run
the applet (requires IE+Java)
Click to enlarge Click here to run
the applet (requires IE+Java)
The four problems are integrated into a task in the unit of linear functions of VisualMath (Figure 9). To support structural similarity, the four problems in the task share the same quantities and all four could be solved by the same equation: 16x+12(x-1) = 100 where x is the time travelled by the first biker. The task is built upon a dynamic distance-time diagram where a given model consist of two linear functions in intervals can be constructed by alterations of a given model. The four graphs of distance as a function of time are identical in the f(t) function but different in the g(t) function.
The data given for the second interval function is what makes problem 3 the one to solve immediately, while the other three seem to require further data supporting formulation of g(t). The solution of problem 3 (formulating f(x) and g(x) and computing the intersection of the two functions’ segments) then supports the missing data in the rest of the problems that can then be modeled and solved. Please note that this distinction between problem 3 and the rest is relevant only for function-based algebra approach where students attempt to construct a comparison of two functions of a single variable. Once one identifies and explains the similarity among the problems (using the interactive tool) the challenge is to use the similarity in order to decide which problem can be solved independently and how it can inform the attempts to solve the rest of the problems. Thus, by presenting a collection of problems that can be identified as similar throughout the interactive graphical alterations, the challenge of solving each of the word problem turns into an exercise in a problem-solving heuristics known as “find a similar simpler problem” (Polya, 1957).
 Click here to run
the applet (requires IE+Java)
Click here to run
the applet (requires IE+Java)
This example of zooming into a single cell in order to analyze the learning occasion illustrates the challenge of redesigning the pedagogy that would make the new epistemological assumptions relevant to algebra teaching and learning.
6. The Design of Textbooks
6Textbooks provide guidance for teachers about what should be content of study and how it should be learned, and they organize the content for students. Therefore, textbooks remain essential mediators between the vision and the teaching. But a bound book that assumes a uniform progression for all students may not best serve the development of ideas through guided inquiry. "Learning by the book” refers worldwide to passive learning, and "teaching by the book" often refers to a teaching style that regards the textbook as a major authority on the content and the knowledge that students should possess. We envisioned the textbook as a mediator that encourages engagement: of the teacher to plan the instruction in a variety of ways, and of the students, by providing and demanding interactivity. In the current technology of eBooks, it is assumed that hypertext, multimodal reading, and interaction with embedded dynamic diagrams and tools are possible. Years before hypertext and digital texts were available, we sought designs that provide incentives for multi-modal and non-sequential reading. The engagement with tools was then designed to be part of the book, and tasks used a variety of formats to support conjecturing and to organize conjectures. I focus here on the design process of an eTextbook – the VisualMath Function eBook, which was designed in 2001-4 as a second edition of the printed VisualMath algebra books (Yerushalmy, M., Katriel, H. & Shternberg, B. 2002/4).
The museum view was a leading image in the design of the VisualMath Function eBook. The views borrowed from the museum setting and used to form our guided inquiry vision were consistent with the distinction Kress and van Leeuwen (1996) made to describe linear and nonlinear texts. They compared linear texts to “an exhibition in which the paintings are hung in long corridors through which the visitors must move, following signs, to eventually end up at the exit,” and non-linear texts to an “exhibition in a large room which visitors can traverse any way they like… It will not be random that a particular major sculpture is placed in the center of the room, or that a particular major painting has been hung on the wall opposite the entrance, to be noticed first by all visitors entering the room” (p. 223).
The Design of the exhibits
1 Click to enlarge
Click here to run
the applet (requires IE+Java)
Click to enlarge
Click here to run
the applet (requires IE+Java)
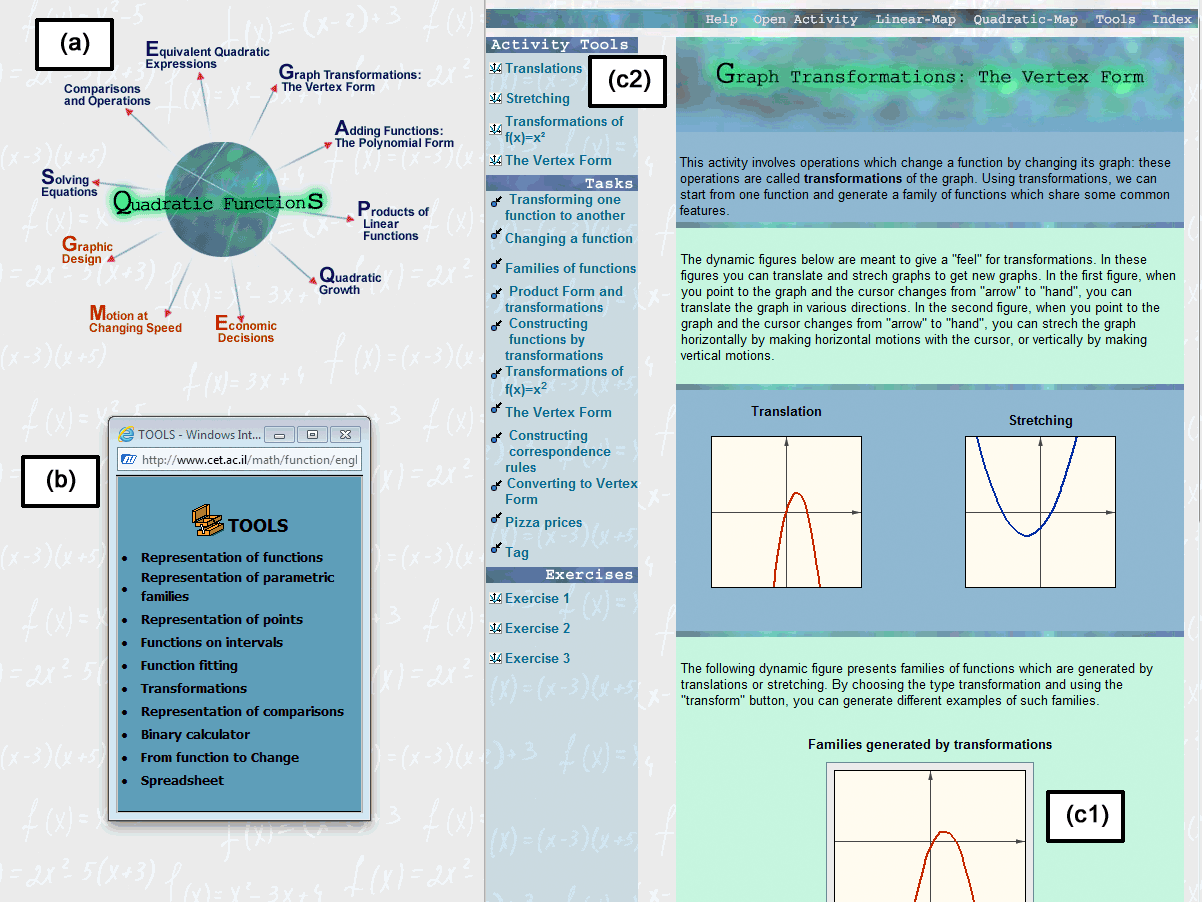
In its current stage the VisualMath eBook accommodates two exhibit halls: the linear and the quadratic. The workshop area provides general-purpose tools for doing mathematics. The museum could accommodate additional exhibits, each one a row on the map – a mathematical object. Entering the hall, the tour leads to various galleries chosen along the columns of the map – the mathematical operations. Each gallery consists of a central piece that reflects the essence of the mathematical operation at hand and a few (2-3) separate rooms (Figure 10). Each room accommodates the “art,” but the design attempts to engage the visitor in different ways: there are tasks (to learn problem solving), tools (hands-on explorations within limited scope of the gallery), and exercises (to improve skills). To keep the visitors alert and to have them come back, the art is changed frequently: exercises, data, and diagrams may be randomly changed by the curator’s directions, but the similarity to other art on display is always retained.
 Click here to run
the applet (requires IE+Java)
Click here to run
the applet (requires IE+Java)
The Quadratic Exhibit hall (a) includes 10 Galleries and (b) A Workshop area; the (c) Transformation Gallery consists of: (c1) A Central piece and (c2) Three Rooms.
This is the “backbone” of the book, which was designed to correspond to the structure of the 2D double-layered map. It contains required content for 7-10th grade algebra and for the topic of functions in Israel, and it is constructed following the approach of technology-based guided inquiry. Within this mathematical structure and the inquiry perspective we adopted, the major challenge of the design remained the tasks.
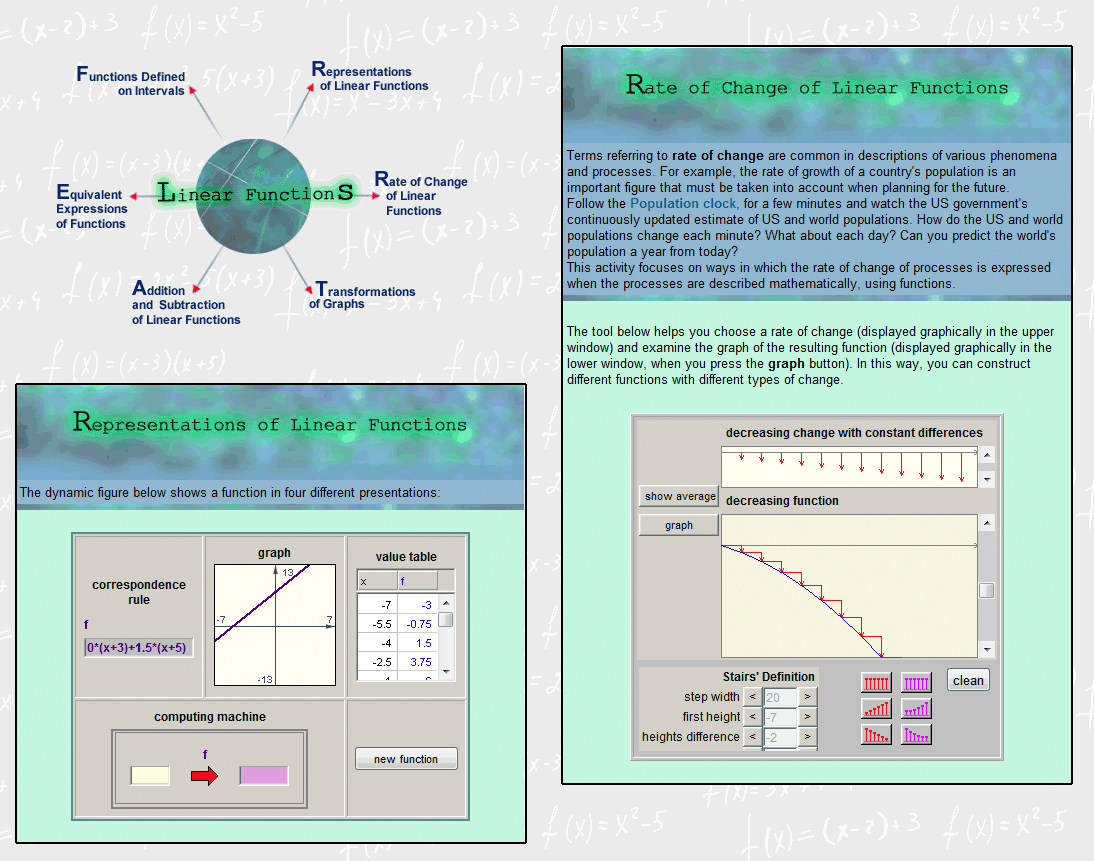
Planning the tasks involved redesigning those tasks that were already included in the printed VisualMath textbooks and reengineering the technology as each activity was devised with the interactive diagram as its core. There was yet another challenge that involved changes to the solidly defined structure. Because there are too many galleries, and too many rooms in each gallery for the visitor to become engaged with each one of them separately, we had to reduce the number of galleries. For example, in the linear exhibit, assuming that it provides a first acquaintance with the approach, and based on the requirements of the syllabus, we paid attention to five operations: representing, analyzing, modifying, operating with, and transforming.
 Click to enlarge
Click here to run
the applet (requires IE+Java)
Click to enlarge
Click here to run
the applet (requires IE+Java)
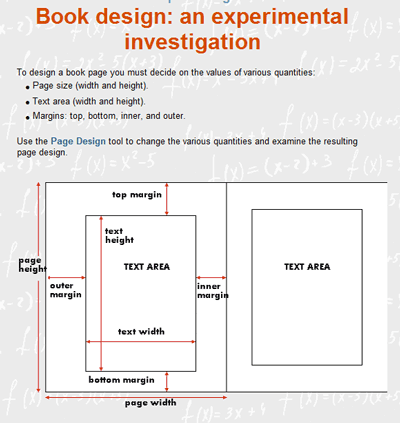
We organized the five operations into six galleries (Figure 11). In the quadratic exhibit we included ten galleries. Seven of these relate directly to the five operations (comparing, analyzing, modifying, transforming, and operating with), and three are organized around three central quadratic models: motion in constant acceleration, area, and economic phenomena. Whereas each of the operation galleries includes tasks in context, the emphasis in the modeling galleries is different, and although they were designed with the mathematics of quadratics in mind, their focus is on the phenomena such as kinematics or max/min economic models. The next few examples from the Quadratic unit (Figure 10) should illustrate central design intentions that attempt to make the “museum image” visible.
Designing the Visit: Three Quadratic Tours
2There are different ways of visiting the exhibition hall, and museum guides provide different tours. Most visitors may require assistance, although there are those who would prefer to study the art by wandering around on their own and reading the information that appears next to the exhibits. There may be others who have already heard and read about the recommended tours or are revisiting the museum and would like to do it their own way. After a gallery has been chosen, the guide may or may not leave the visitors alone for various periods of time. The guide may leave the central piece at the entrance to be explored later, and lead the visitor directly to some other rooms. The guide may also suggest that before visiting the exhibit, guests should enter the tools shop to try out the interactive environment that would later help them understand the art. The design of the eBook challenges teachers in a similar way. As in the museum, they start as first-time visitors, exploring the domain of knowledge. Then, using the textbook to plan their course and help their students, they assume the role of the tour guide. Most likely, a teacher in a classroom setting would initially guide students closely, but would ask the students to take their time, use the interactive tools, or take notes. After teachers have accumulated some experience in the gallery and feel secure, they may consider suggesting that groups of students choose their own routes.
Assuming that visitors are already familiar with the three representations of functions, at least three conceptual guided tours are suggested for teaching the Quadratic unit: The analyzing tour, the solving (comparing) tour, and the algebraic structure (modifying and operating) tour.
Analyzing
A teacher could plan the course of the analyzing tour based on the concept of non-constant rate. This could be achieved by first learning about rates (Figure 12a) or by first focusing on the motion as a model of constant acceleration (Figure 12b) .

Solving
The students have already learned comparisons of linear functions and have an idea of equivalent comparisons, therefore an alternative focus can be on equations. The tour starts with comparisons of quadratic expressions (Figure 12c) continuing with emphasis on operations on equations and inequalities (Figure 12d) , and on the concept of equivalence. The solving gallery provides tasks to be used for experiencing and practicing how to solve equations. Many tasks in various other galleries require solving and could be used to enrich the visit.

Algebraic structure
3The algebraic structure tour could begin with the investigation of binary products of linear functions (Figure 12e) or with the area modeling unit (Figure 12f).
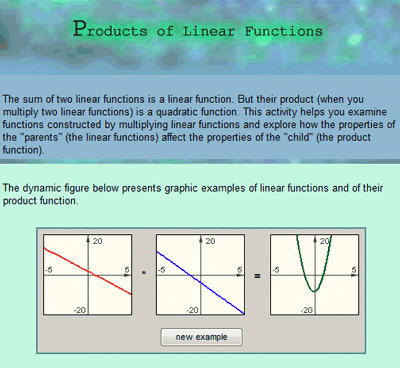
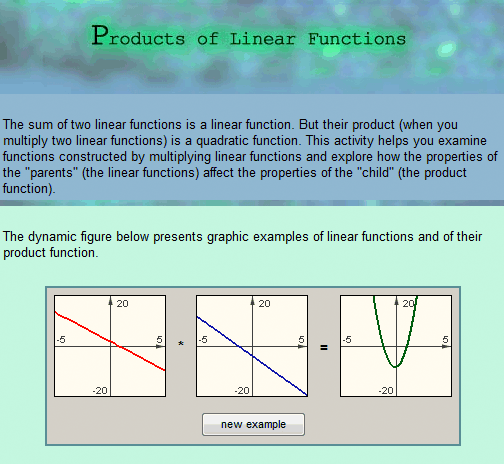

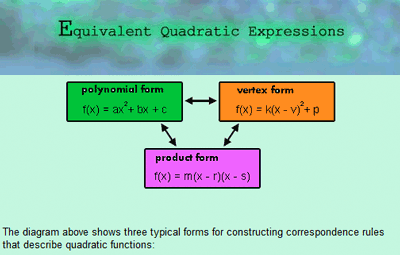
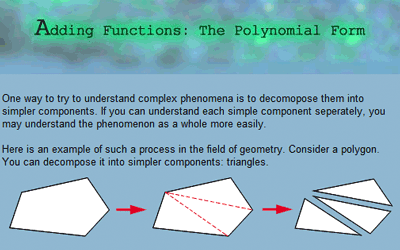
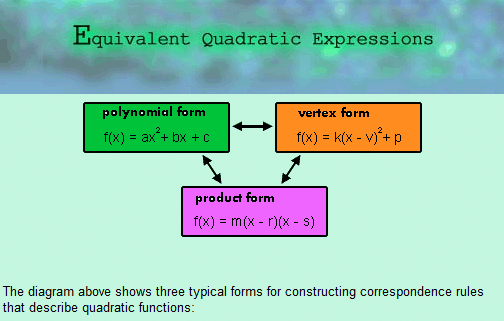
The quadratic structure has three different forms (product, polynomial, and vertex), and the manipulations required to arrive from one to the other are an important part of understanding quadratic expressions. At least four galleries would be visited on this tour: equivalent expressions (Figure 12g), adding (Figure 12h), multiplying, and transforming (Figure 12i).
It is reasonable to assume that the same teacher would make different choices based on the different settings and resources that students bring to the course. For example, if the students’ previous experience in algebra does not include thorough familiarity with functions, it may be better to start with modeling graphic designs based on the known geometry of rectangles. Other teachers reported that they had augmented the rate tour by visiting the linear room of the rate gallery, yet others alternated the order in which they visited the galleries, and selected the exercise rooms in each gallery as the only ones to visit, because they were able to use the dynamic diagram designed for practicing as a tool for exploration under their guidance, obviating the need to go through the other rooms.
These and other teacher engagements in planning a sequence that is not unequivocally defined require familiarity with and understanding of the various units of the book. The essential pedagogical understanding is that of the organizing map: objects, operations, representations, the learning occasions involved, and the understanding of the exhibit map as reflecting various settings for optional formats of guidance.
Personalizing the tour further
4So far I described affordances designed to support teachers in designing their plot for the course and in guiding the inquiry. Yet, there are other design efforts to support the museum experience and the inquiry pedagogy; efforts that are related to the ways that students can bring their personal views, resources and imagination when engaging with the mathematical text.
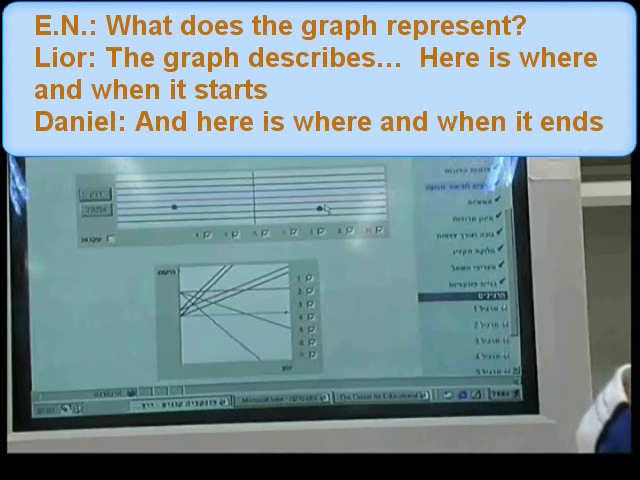
Reading mathematical text as reading good prose of any sort demands a sense of immersion and sinking into a mode of “disappearance” into the book. Young (2007) describes the interactive reading as being an internal slow conversation about the ideas carefully crafted by the author. Reading the VisualMath multimodal text – explore or solve - often consists of cycles of inquiry either individually or with classroom mates. Major design efforts invested in offering Interactive Diagram that provide opportunities for presenting the authors’ idea to be the subject of the reader’s inquiry. An Interactive Diagram (ID) is a relatively small and simple software application (applet) built around a pre-constructed example. An ID includes the characteristic features of a static diagram and of a tool. The diagrams that are centered on an animated race simulation offer different opportunities for learning. The examples are drawn from the long term research program carried by Naftaliev and Yerushalmy since 2007 to the present . I would shortly demonstrate analysis of students’ explorations carried with two types of interactive diagrams: narrating and elaborating.
Narrating IDs are designed to be the principal delivery channel of the activity’s message. Similar to the narrator’s voice, narrating IDs are designed to call for action in a manner that supports the construction of the principal ideas of the task. Whereas elaborating diagrams are designed for the students to approach and explore a variety of occurrences, narrating diagrams are intended to help students articulate a narration of appropriate interpretations. Such a narration defines the structure for the available options for exploration. Although it provides tools that promote inquiry, it also sets the boundaries that can guide inquiry and provide a framework and narration of the story to be learned in the process of working on the task.
Discovering the connection between a constant distance-time function graph and a lack of motion (documented in Figure 13) was made possible by activating the animation that is hot-linked to the animated graph. The hot-link contributed to discovering the noticeable visual surprise about the static dot, but linking the seven dots to the appropriate seven graphs was more difficult. The growth of a naïve conjecture and the cycles of conjectures and refutations that followed are based on the designed conflict between the two animated representations: one of actual motion and the other that represents change of position in time.
Elaborating interactive diagrams are designed to provide means for students to engage in activities that lead to the formulation of a solution in different ways and to afford meta-cognitive actions: compare the possibilities, analyze each and reflect upon their choices.
 Watch movie (needs Flash player)
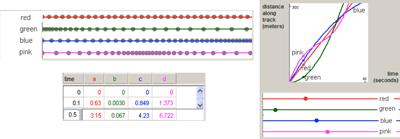
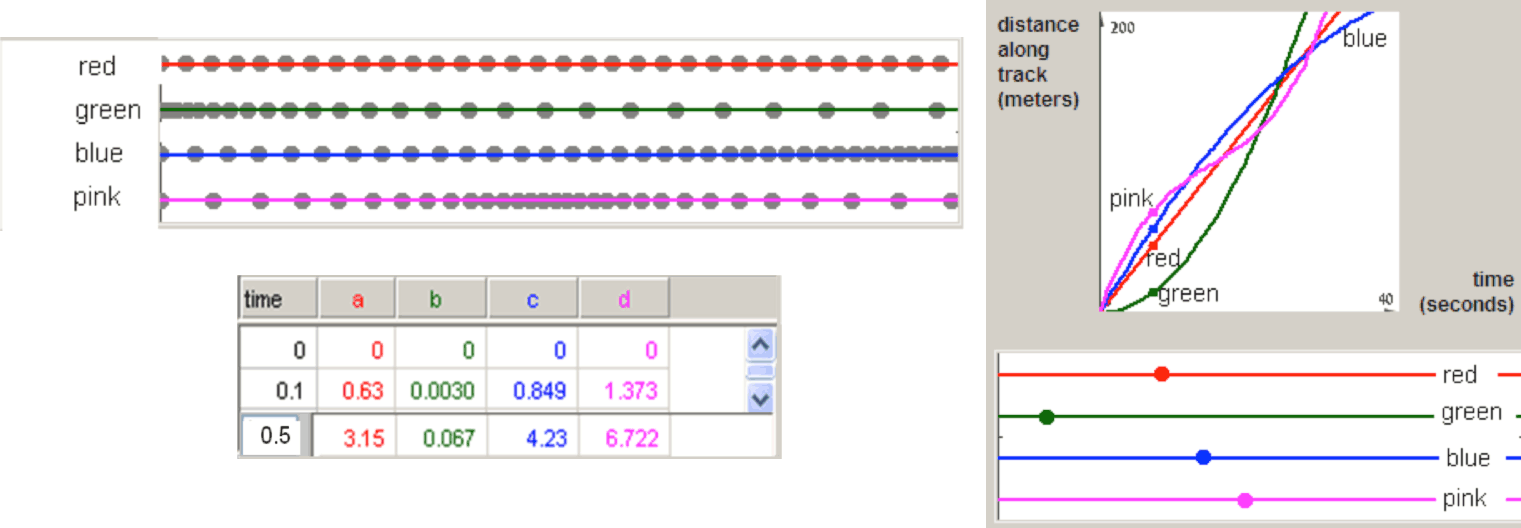
Three groups of students attempting to solve the “200 meters” race problem chose to concentrate on different representations and linking tools (Figure 14): one group analyzed the traces that were left throughout the run, others attempt to understand the information that can be driven from the numerical table while others spent longer time on attempts to explain the geometric behaviour of the graphs and it relation to specific moments along the race.
 Click here to run
the applet (requires IE+Java)
Click here to run
the applet (requires IE+Java)
Naftaliev (2012), summarizing her analysis of students’ solutions with the “20 meters” problem and other elaborating diagrams, argues: “In the elaborating diagram, understanding the generic nature of the animated example advanced with the needs and choices of the students to explore a variety of unfamiliar representations and to interpret the links that were often designed to create uncertainties.” (p. 166) The various linking tools and representations in the Elaborating diagram lead to different problem-solving processes and a variety of solutions. The differences between methods were manifest in the variety of the significant items in the examples, in the representations students chose to work with, in the order of preference of the various representations, in the choice to use or ignore the included tools, and in the attitude toward the various aspects of the motion process. The noteworthy finding in the problem-solving processes exhibited by students with Narrating diagrams is the unusually extensive mental work, encompassing an entire cycle of logical argumentation (raising assumptions, deriving conclusions through conjectures and refutations) without the multiple replaying of the animation that is normally involved in solutions with interactive tools (Naftaliev & Yerushalmy, to appear).
6. Concluding Notes about Incompleteness
6There are many ways of describing such a long process of design and development of an innovative curriculum. But the story that worked for us and that is less frequently told is the challenge of designing a coherent conceptual structure for secondary school mathematics, the need for defining a mathematical view, and the need for designing a conceptual organizing map that can guide the design of materials. The restructuring of the mathematical subject is the design story that guided us in the development of the VisualMath curriculum. The design of the organizational map was our major challenge of designing the algebra inquiry; it guided us in posing questions of order, in asking how known algebra tasks may be based on new resources and in finding the relevance of traditional tasks that do not seem to be the natural subject to address in an inquiry environment of the type that we envisioned. We started by a set of thought experiments, then prepared a pilot with users followed by cycles of research and design of technology tools, tasks, instructional materials in the form of textbooks, and teachers’ development programs. Many aspects have not been discussed here, which would have received greater emphasis had I chosen to describe the VisualMath project by means of two other stories.
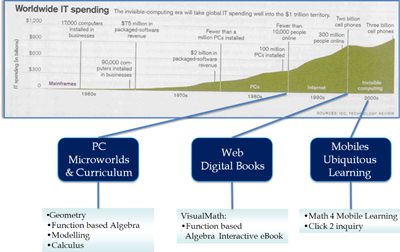
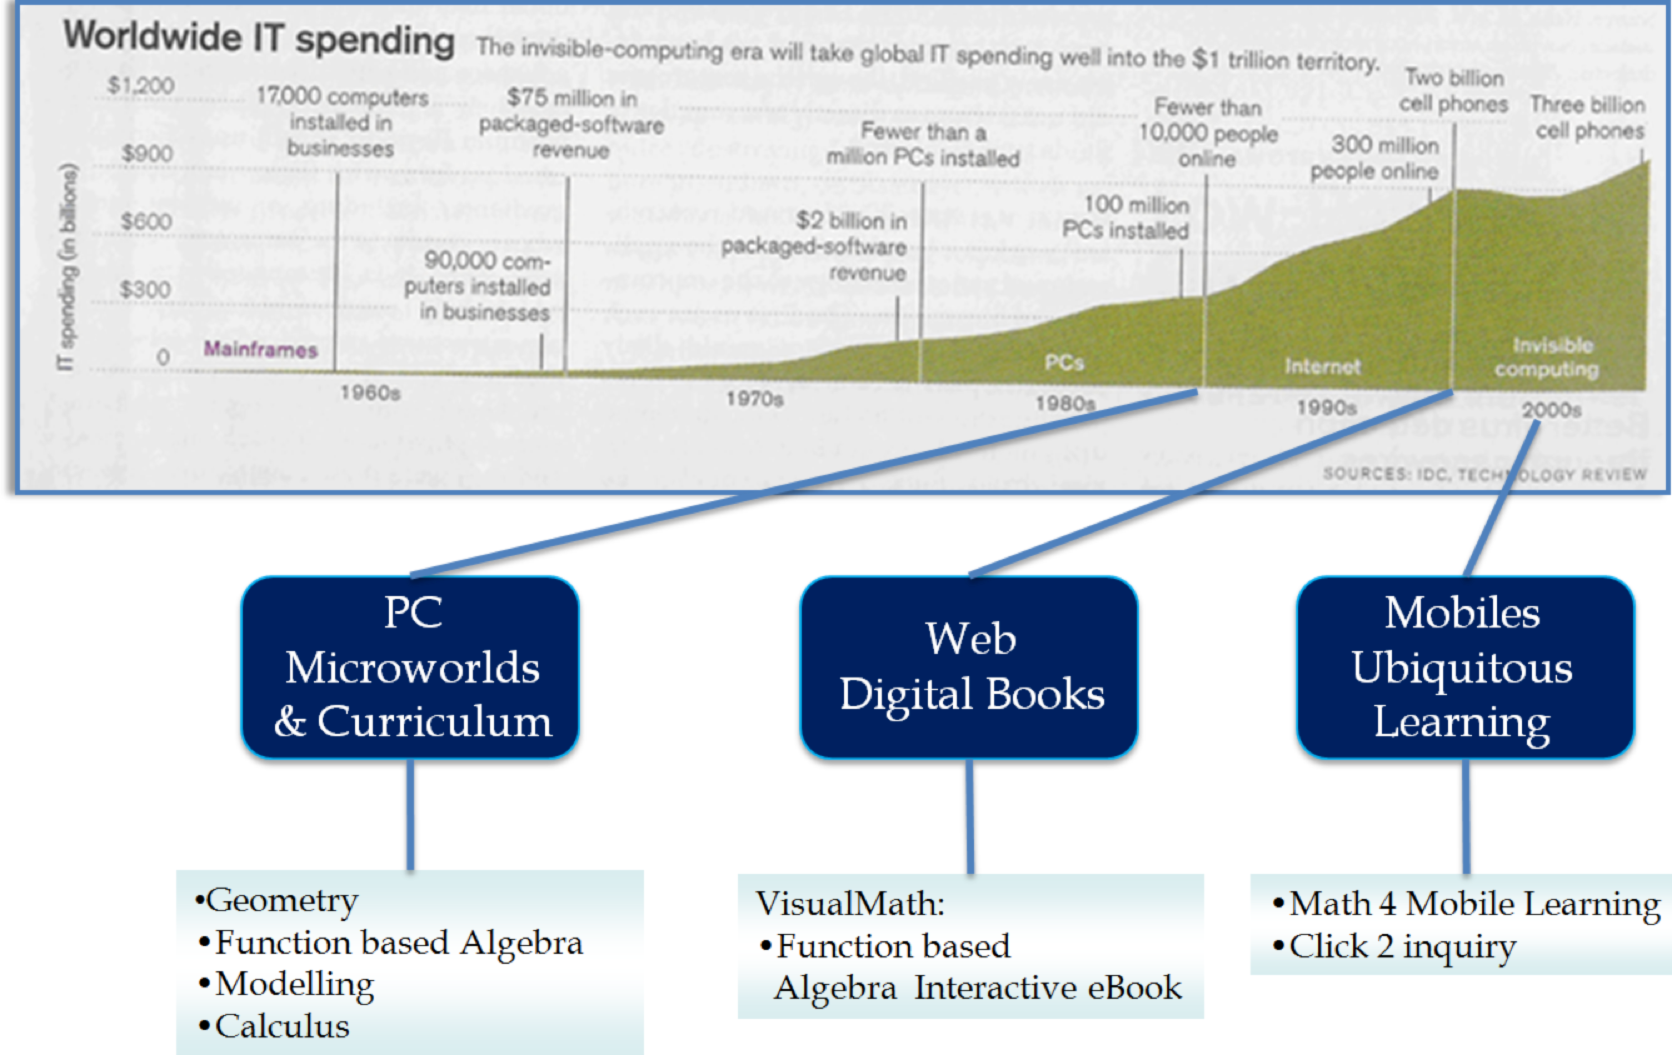
One of the stories focuses mainly on innovations in technological resources: VisualMath started with the first PCs that appeared on the market. Over the years graphic capabilities and tangible interfaces have been developed, followed by the Internet, the Web, and mobile devices. These technologies were not developed for educational purposes, but as shown in Figure 15, they ended up as major players in education reform. Our ideas and the design of VisualMath evolved continually in parallel with the new technological capabilities, especially affected by three landmarks: stand-alone microworlds, interactive Web-based textbooks, and mobile learning.
Yet another approach to describing the development of VisualMath would be to tell the story of the design of mathematical pedagogical practices and of the development of instructional patterns that facilitate guided inquiry. The focus of such a description would be on the design of tasks, and it would dwell on the conceptual challenges faced by curriculum developers aiming to support would-be “constructivist teachers” by challenging their beliefs about cognitive processes of mathematical thinking and about their pedagogical practices. It is the challenging feeling of incompleteness based on coherent organization and principles that typify the nature of guided inquiry, and it is probably reflected in the incompleteness of the story told here.
References
iiBotzer, G. & Yerushalmy, M. (2008) Turning artifacts into meaningful signs through bodily interaction: the case of motion graphs. The International Journal for Computers in Mathematical learning. 13.
Chazan, D. & Yerushalmy, M. (2003). On appreciating the cognitive complexity of school algebra: Research on algebra learning and directions of curricular change. In J. Kilpatrick, D. Schifter, & G. Martin. A Research Companion to the Principles and Standards for School Mathematics. pp. 123-135 NCTM, Reston, Virginia.
Gafni, R. (1996). Using multiple representations of functions to improve semantics understanding of algebraic expressions and equations. Doctoral dissertation (in Hebrew). The University of Haifa, IL.
Schoenfeld, A. (2002). Making Mathematics Work for all Children: Issues of Standards, Testing, and Equity. Educational Researcher, 31(1), 13-25.
Schwartz, J. L. (1995). Shuttling Between the Particular and the General: Reflections on the Role of Conjecture and Hypothesis in the Generation of Knowledge in Science and Mathematics. Software Goes to School. D. N. Perkins, J. L. Schwartz, M. M. West and M. S. Wiske. NY, Oxford University Press. Pp 93-105.
Schwartz, J.L. & Kenney, J. M. (2012) Getting from Arithmetic to Algebra: Balanced Assessment for the Transition. Teachers College Press, NY.
Schwartz, J.L. & Yerushalmy, M. (1987) The Geometric Supposer: The computer as an intellectual prosthetic for the making of conjectures. The College Mathematics Journal. 18(1). 58-65.
Schwartz, J.L. & Yerushalmy, M. (2003) Getting Students to Function in Algebra. Unpublished Manuscript. The institute for Alternatives in Education, University of Haifa. www.edu.haifa.ac.il/personal/michalyr/pdf/getting-students-to-fn.pdf
Shternberg, B., Yerushalmy, M. (2003) Models of functions and models of situations: On design of a modeling based learning environment In H. M. Doerr & R. Lesh (Eds.) Beyond constructivism: A model and modeling perspective on teaching, learning, and problem solving in mathematics education. pp. 479-500. Mahwah, NJ: Lawrence Erlbaum.
Tall, D. (2002) Published in Intelligence, Learning and Understanding – A Tribute to Richard Skemp (eds David Tall and Michael Thomas), 2002, pp. 151–177. PostPressed, http://www.postpressed.com.au.
CET (1995) Visual Math: Algebra. Center for Educational Technology, Ramat-Aviv. http://www.cet.ac.il/math-international/visualizing.htm
Yerushalmy, M. (1999). Making Exploration Visible: On Software Design and School Algebra Curriculum. International Journal for Computers in Mathematical Learning, 4 (2-3), 169-189.
Yerushalmy, M & Shterenberg, B. (1993). The Function Sketcher (in Hebrew, English and Arabic) for Center of Educational Technology, Ramat-Aviv. http://www.cet.ac.il/math-international/software1.asp
Yerushalmy, M. & Shternberg, B. (2001). A Visual Course to Functions. In A. Cuoco & F. Curcio (Eds.) The Roles of Representations in School Mathematics. The 2001 Yearbook of the National Council of Teachers of Mathematics. pp. 251-268. NCTM, Reston, Virginia.
Yerushalmy, M & Shterenberg, B. & Schwartz, J.L. (2001). Move On! Motion Laboratory (software in Hebrew and English) for the Center of Educational Technology, Ramat-Aviv. http://www.cet.ac.il/math-international/more12.asp
Yerushalmy, M., & Chazan, D. (2002). Flux in school algebra: Curricular change, graphing technology, and research on student learning and teacher knowledge. In L. English (Ed.) Handbook of International Research in Mathematics Education (pp. 725-755). Hillsdale, NJ: Erlbaum.
Yerushalmy, M., Katriel, H. & Shternberg, B. (2002/4). VisualMath: Function. Interactive Mathematics Text. CET: The Centre of Educational Technology, Ramat-Aviv. www.cet.ac.il/math/function/english.
Footnotes
iii
[1] Curriculum cannot
be developed by a single person. VisualMath was developed by a team
of devoted educators including graduate students at the University
of Haifa, school teachers and students. It was the result of a
long-term partnership with the secondary mathematics team of the
Center for Educational Technology (CET), Israel http://cet.org.il/pages/About.aspx
The development is based on long-term partnerships with Judah
L. Schwartz and Daniel Chazan.
About the Author
ivProfessor Michal Yerushalmy (B.Sc., Technion,IL, M.Sc. Technion,IL, Ed.D. Harvard University) is on the faculty of the Mathematics Education department in the Faculty of Education. She is the director of the Research Institute of Alternatives in Education at the University of Haifa Israel. Her interests are in learning with computerized environments. Prof. Yerushalmy research focus is on the study of mathematical learning and teaching, on design and implementation of reformed curricula and on cognitive processes involved in learning with multiple external representations, bodily interactions and modeling. She authored and designed numerous software packages in geometry, algebra and calculus and developed the interactive "VisualMath" secondary school mathematics web curriculum. Current projects focus on learning with interactive diagrams in interactive electronic books and on mLearning. In the Math4Mobile project Prof. Yerushalmy offers ways to make technology available for construction of knowledge for everyone everywhere. Over the Past 25 years she has taught courses of didactic methods of mathematics and on cognitive and curricular implications of technology for education.
Recently, Prof. Yerushalmy won The 2010 ISDDE Prize for Excellence in Educational Design