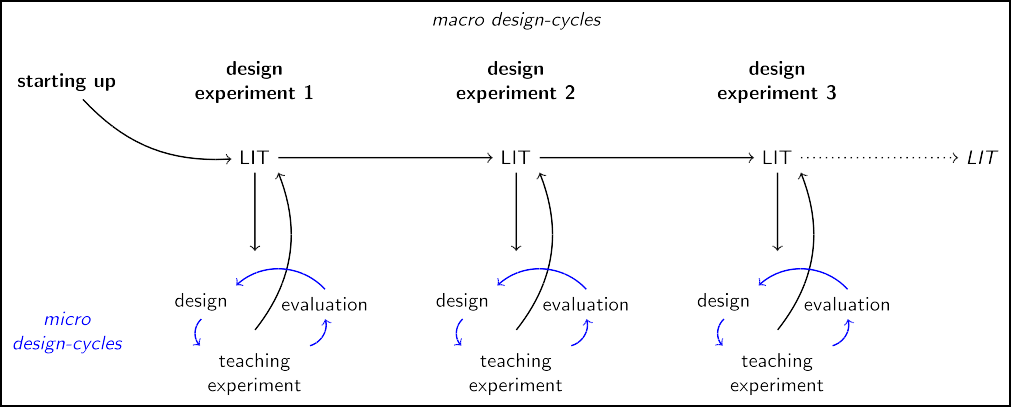
We followed the approach to design research outlined in Gravemeijer & Cobb (2013) in order to develop a LIT on teaching instantaneous speed in 5th grade. This LIT, and the prototypical instructional sequence by which it was instantiated, was elaborated, adapted, and refined in three macro design-cycles called design experiments (Cobb, 2003; Gravemeijer & Cobb, 2013) (Figure 1). A design experiment has three phases.
Exploring instantaneous speed in fifth grade
Huub de Beer, Koeno Gravemeijer, and Michiel van Eijck
Abstract
iThis paper illustrates the development of a prototypical instructional sequence on instantaneous speed for 5th grade in terms of the researchers' own learning process. The development of this instructional sequence in a design research project is tracked from the starting-up phase through three subsequent design experiments in terms of a framework that encompasses both the design decisions and the theoretical and experiential foundations for those decisions. Such a framework of reference may take the form of a local instruction theory that offers a rationale for the instructional sequence on the basis of which teachers and educational designers may adapt the instructional sequence to their own needs.
Introduction
iiIn reaction to the advent of the information society, some researchers argue there is a need for a new and innovative science and technology education in primary school (Gravemeijer & Eerde, 2009; Keulen, 2009; Léna, 2006; Millar & Osborne, 1998). With the advent of ubiquitous networked computing devices connected to sensors, the importance of understanding dynamic phenomena in every-day life is growing. Key to a better understanding of dynamic phenomena is the concept of instantaneous rate of change. In the context of primary school we prefer to speak of ‘speed’ because students of this age will not have developed the level of abstraction associated with the use of ‘rate of change’ in the literature. Currently, instantaneous speed is not part of the primary school curriculum in the Netherlands; conventionally, instantaneous rate of change is taught first in a calculus course in late high school or college. To meet the requirements of the information society, however, one may argue for teaching this topic much earlier.
Because design research is well-suited to explore the teaching of topics in earlier grade levels than they are usually taught (Kelly, 2013), we use this research methodology to explore how to teach instantaneous speed in grade five. Design research may take various forms. The type of design research we have in mind here focuses on learning processes (Gravemeijer & Cobb, 2013). In this type of design research, special attention is paid to the origin and development of the theoretical claims through a process that, to a large extent, comes down to documenting both the actual educational-design practice and the researchers' own learning process.
Design research does not follow a (quasi-)experimental research design. Instead, the process by which claims are produced has to justify its results in a more direct manner. In relation to this, Smaling (1990) borrows ‘virtual repeatability’ from ethnography as an alternative for the prevailing criterion of repeatability. He links this methodological norm of virtual repeatability to the criterion of ‘trackability’. Outsiders should be able to retrace the learning process of the researchers in such a manner that it becomes virtually repeatable for them. This then would allow them to judge the credibility of the claims for themselves.
Characteristic for this type of design research is that the design revolves around the students' mental activities. Here we may think of Simon’s (1995) notion of a hypothetical learning trajectory, which describes the anticipated mental activities the students will engage in when they participate in the envisioned instructional activities, and how those mental activities relate to the learning goals. It is the design, trial, evaluation, and revision of a series of such hypothetical learning trajectories that is at the heart of the learning process of the designers. The consecutive hypothetical learning trajectories are reflexively related to the so-called local instruction theory (LIT). The LIT constitutes the rationale for the instructional sequence that is being developed and consists of a theory about a potential learning process for a given topic instantiated by that instructional sequence, and the means of supporting that process. The researchers start out with a conjectured LIT, which is revised and adapted during multiple design experiments.
In this paper we describe such a learning process to illuminate how the theory-driven nature of design research interacts with educational design practices. In particular, we elaborate the grounds for justification of the claims put forth in the LIT by tracking the theoretical and experiential foundations of the design decisions we made during the design research. Before we describe our own learning process, however, we detail the approach to design research we used and the underlying process of validating and generating new explanatory conjectures.
Design research
iii- In the preparatory phase, the LIT is (re)formulated and used to design an instructional sequence.
- Subsequently, that instructional sequence is tried in a teaching experiment that consists of a sequence of micro design-cycles of (re)developing, trying out, evaluating, and adapting instructional activities and materials (Figure 1, blue cycles).
- Next, a two-step retrospective analysis is carried out that is modeled after Glaser & Strauss’s (1967) comparative method. In particular, the elaboration of Cobb & Whitenack (1996) on this method was used. After formulating conjectures about What happened? during the teaching experiments and testing these conjectures against the data collected, a second round of analysis is carried out by formulating conjectures about Why did it happen?. These conjectures are also tested against the data collection.
The results of the retrospective analysis are used to adapt and improve the LIT, which is input for the next design experiment.
A standard goal for classical educational research is to establish whether intervention A works better than intervention B. The goal of design research, however, is quite different. Here the goal is to generate a theory on how the intervention works. This distinction may be linked to two conceptions of causality, as described by Maxwell (2004): a regularity-oriented causality, and a process-oriented causality, respectively.
The former, which looks at the frequency with which an assumed cause is followed by a presumed effect, is typical for quantitative research in education. In contrast, the kind of research we are discussing here employs a process-oriented perspective on causality, which “deals with events and the processes that connect them; it is based on an analysis of the causal processes by which some events influence others.” (Maxwell, 2004, p. 5) It is based on the idea that causation is a complex process that is dependent on a combination of variables and circumstances. In principle, causal claims could be based on a single case. When aiming at LITs, the unit of analysis will not be just one student but the classroom as a whole. As a result, to justify that there is a causal relation, narrative explanations can be used (Abell, 2004). Applied to educational settings, Maxwell (2004) argues that to “develop adequate explanations of educational phenomena (…), we need to use methods that can investigate the involvement of particular contexts in the processes that generate these phenomena and outcomes.” (p. 7) We may argue that design research deploys two such methods: validating existing conjectures and generating new explanatory conjectures.
In each design experiment, the conjectures about the learning process and the means of support are substantiated in the instructional activities and materials that are developed and refined in multiple micro-design cycles during the teaching experiments phase. Conjectures that are confirmed by the students’ actual learning process remain part of the LIT and are tried and refined again in the next design experiment. As a result, conjectures are confirmed or rejected in multiple different situations, offering a form of triangulation that adds to our understanding of students’ learning processes in terms of these conjectures. Those observations enabled us to develop some theories about the mechanisms that were at play here.
In addition to this, new explanatory conjectures are generated through abductive reasoning, which is to “rationalize certain surprising facts by the adoption of an explanatory hypothesis” (Fann, 1970), allowing us to focus on causal processes that we did not anticipate in the LIT. A surprising fact is an indication that our understanding of the students’ learning processes did not match the actual students’ learning processes; it suggests a gap in our theory. To fill that gap, we select data during the retrospective analysis that allows us to focus on what happened during the unexpected event to explore plausible hypotheses of why it happened. By detailing our learning process, we may show why and how we generated new explanatory conjectures.
Interwoven development of the LIT and our own learning process
ivIn this section we describe the development of the LIT to illuminate our own learning process during the development of an instructional sequence on instantaneous speed. However, given the iterative and interventionist nature of design research, one of the challenges of design research is “to characterize the complexity, fragility, messiness, and eventual solidity of the design and doing so in a way that will be valuable to others.” (Barab & Squire, 2004, pp. 3–4). Because it is almost impossible to give a full and complete account of one's learning process, we focus on the main learning moments and we will briefly summarize what we learned after each design experiment. We start by elaborating on the starting points both in terms of our own perspective on learning as well as in terms of developing the initial LIT from that perspective.
Forming our initial ideas
1Our own perspective on educational design
Beyond a general commitment to a social-constructivist perspective on learning, we subscribe to the theory of realistic mathematics education (RME) (Gravemeijer, 1999; Treffers, 1987). Central to RME theory is the adage that students should experience mathematics as the activity of doing mathematics, and should be supported in reinventing the mathematics they are expected to learn. In relation to this, three instructional design heuristics are formulated: guided reinvention, didactical phenomenology, and emergent modeling (Gravemeijer & Doorman, 1999). According to the guided reinvention heuristic, a route has to be mapped out that allows the students to (re)invent the intended mathematics by themselves. Here, the designer can take both the history of mathematics and students’ informal solution procedures as sources of inspiration. In the case of speed, history shows us that intuitive notions of instantaneous velocity preceded the more general conception of instantaneous speed as the limit of average speeds on increasingly smaller intervals. This suggests trying to build on this intuitive notion of instantaneous velocity. The choice of guided reinvention as our point of departure is intertwined with the way we frame our goals. Our primary goal is for the students to develop a framework of mathematical relations, which involve co-variance, tangent lines, rise-over-run, and eventually, speed as a variable.
The didactical phenomenology heuristic advises one to look for the applications of the mathematical concepts or tools under consideration, and analyze the relation between the former and the latter from a didactical perspective. In this case, the phenomenon of the speed of water rising in the context of filling glassware comes to the fore as a suitable point of impact for the reinvention process. The didactical phenomenology also advises a phenomenological exploration to ensure a broad conceptual base. However, the small number of lessons did not allow us to do justice to this idea.
The emergent modeling design heuristic asks for models that can have their starting point in a model of the students’ own informal mathematical activity, and can develop into a model for more formal mathematical reasoning. Key in this transition is that the students develop a network of mathematical relations, while acting with the model. In this manner, the model may begin to derive its meaning from the mathematical relations involved, and may start to function as a model for more formal mathematics reasoning. In our case, the model may loosely be defined as ‘visual representations of the filling process’. These representations may first come to the fore as models of water heights at consecutive time points, and gradually evolve into a model for reasoning about the rising speed. We used the underlying idea of a dialectic process of symbolizing and meaning making, in which the symbolizations and the corresponding meaning co-evolve, to formulate the preliminary LIT in the starting-up phase.
Starting-up
This section is a summary of the results and findings presented in Beer (2016).
We started by reviewing the literature on primary-school students’ conceptions of speed. We found that both in this literature and in the primary curriculum, speed is mostly limited to average speed in the context of motion and described by a ratio; instantaneous speed is not mentioned. As instantaneous speed is conventionally first taught in a calculus course, we therefore widened our review to the literature on teaching calculus-like topics earlier in the mathematics curriculum than calculus is conventionally taught. Most of these initiatives used computer simulations and graphs: this enables students without much algebraic skill to reason about change (Kaput & Schorr, 2007; Stroup, 2002). Exemplary is Stroup’s (2002) ‘qualitative calculus’ approach. Stroup critiques the conventional instruction of rate, which treats intuitive qualitative understanding of rate merely as a transitional phase towards a ratio-based understanding of rate, and he argues that developing a qualitative understanding of rate is a worthwhile enterprise in and of itself. We decided to aim at expanding on this approach by supporting 5th graders in developing both a qualitative and a quantitative understanding of rate.
In our search to develop a conception of instantaneous speed while circumventing the complex process of taking the limit of average speeds we looked at the historical development of the concept of instantaneous speed. Long before a formal mathematical definition, an intuitive notion already existed (Doorman, 2005). Around 1335, William Heytesbury defined his intuitive notion of instantaneous velocity as:
“a nonuniform or instantaneous velocity (…) is not measured by the distance traversed, but by the distance which would be traversed by such a point, if it were moved uniformly over such or such a period of time at that degree of velocity with which it is moved in that assigned instant.” (From: Heytesbury (1335) Regule solvendi sophismata, as cited in Clagett (1959, pp. 235–237)).
We assumed that the students’ intuitive notions are close to this historical notion. We therefore formulated a LIT in which we aimed at helping the students to explicate and expand these notions.
We chose the context of filling glassware over the motion context, as we feared that the latter might bring with it unanalyzed terms and procedures. We can trace the origin of this context back to the experienced educational designer Malcolm Swan, who used it in a secondary textbook on functions and graphs (Swan, 1985). We conjectured that the students would come to realize that the speed with which the water level rises in a cocktail glass changes at every instant, and that this speed is continuously diminishing. Building on this insight, the students would come to understand how the shape of a ‘height-time’ graph relates to the rising speed in the glass. By discussing the curved shape of this graph and how it relates to the continuously changing speed, we would have a starting point for deepening their understanding of instantaneous speed.
Preliminary one-on-one teaching experiments
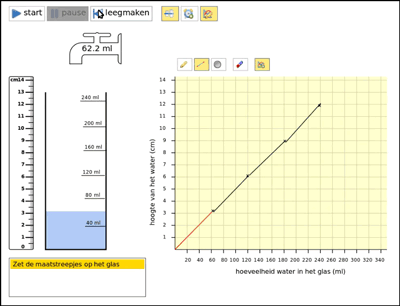
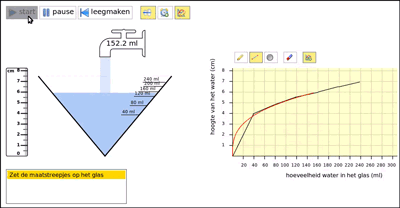
Before elaborating those ideas further, we carried out a series of one-on-one teaching experiments with nine above average performing 5th graders—which we reported on in detail in Beer (2016). We developed a short instructional sequence with the same activities with a highball glass (a cylindrical glass), a cocktail glass, and an Erlenmeyer flask in a computer simulation (Figure 2). For each glass, the students were asked to:
- turn the glass into a measuring cup by dragging hash marks to the right place on the glass (see Figure 2 and Figure 3, left hand side),
- evaluate their solution using the computer simulation,
- draw a graph of filling that glass, and
- again evaluate their solution using the simulation (see Figure 2 and Figure 3, right hand side).
Figure 2. Computer simulation of filling a highball glass
 Explore online at https://heerdebeer.org/DR/DE0/software/longdrink_smal.html
Explore online at https://heerdebeer.org/DR/DE0/software/longdrink_smal.html
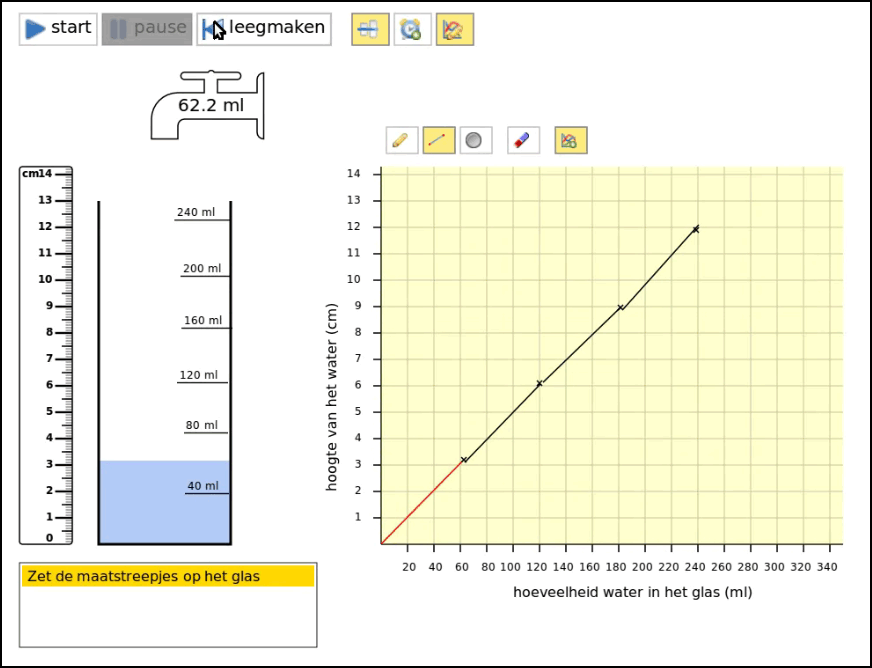
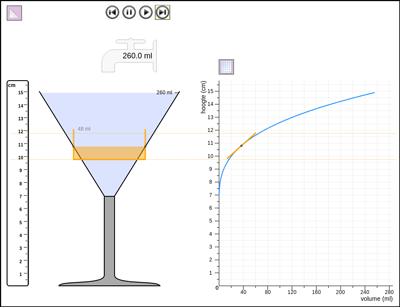
Figure 3. Computer simulation of filling a cocktail glass
 Explore online at https://heerdebeer.org/DR/DE0/software/cocktail.html
Explore online at https://heerdebeer.org/DR/DE0/software/cocktail.html
The teaching experiments showed that the students found the linearity of the process of filling a highball glass self-evident; they spontaneously described this process with a linear graph (Figure 2). When carrying out those tasks for a cocktail glass, however, many students initially fell for the so-called linearity illusion (Bock, Dooren, Janssens, & Verschaffel, 2002). Most students made a linear-gauged measuring cup of the cocktail glass. But when they saw a cocktail glass fill up, they quickly realized that the filling-up was not linear. They could relate the decreasing speed to the increasing width of the glas, arguing that the speed decreases because of the increasing width of the glass. In line with this realization, the students accepted the computer-drawn curve as a better graph for describing filling the cocktail glass than their own hand-drawn straight-lined graphs. They could not, however, explain the curve. Nor could they come up with such a curve by themselves.
We may briefly summarize what we learned:
- Conceiving filling a highball glass as a linear process appeared self-evident for the students.
- This was also the case for the linearity of the graph.
- With the cocktail glass they initially fell for the linearity illusion, but when they saw the simulation, they realized that the rising of the water level slows down.
- They could not draw the correct graph.
- They seemed to appreciate the curve, but could not explain it.
Design experiment 1
2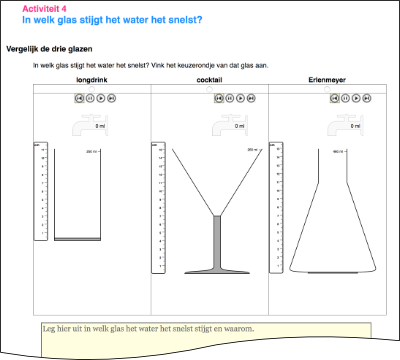
In the first lesson of the teaching experiments of design experiment 1 we tried to imitate the starting-up phase by asking the students to make measuring cups from the highball glass, the cocktail glass, and the Erlenmeyer flask, and evaluate their work by filling up the glasses in the computer simulation. See student materials (Figure 4).
Based on the one-on-one teaching experiments, we expected that the students would have no trouble with the highball glass and would apply the same linear prototype to the cocktail glass. Once they had observed it fill up, they would realize that it is a non-linear situation and relate the decreasing speed to the increasing width of the glass, while formulating the relationship its width and the speed. Hereafter, the students would be able to coordinate water height and volume.

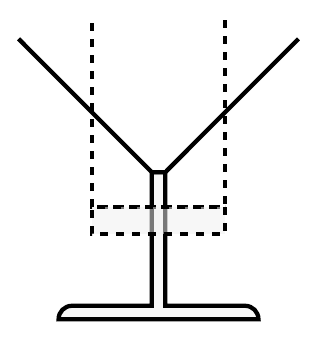
Next, the students would be asked when the water rises with the same speed in both the highball and cocktail glass. Given their informal understanding of the relationship between the width of a glass and speed, they would be expected to come up with the point where both glasses have the same width. We then wanted to support them in realizing they can compute the speed at a specific point by computing the corresponding speed of the highball glass. When prompted to think of a way to determine the speed at another point, we expected the students to imagine a highball glass with the same width as the cocktail glass at that point, and compute its speed (see Figure 5). After introducing a computer-tool to draw an imaginary highball glass on top of other glasses, the students would have a tool available for measuring instantaneous speed in various glassware.
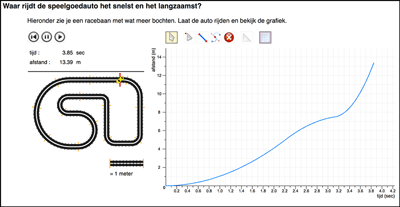
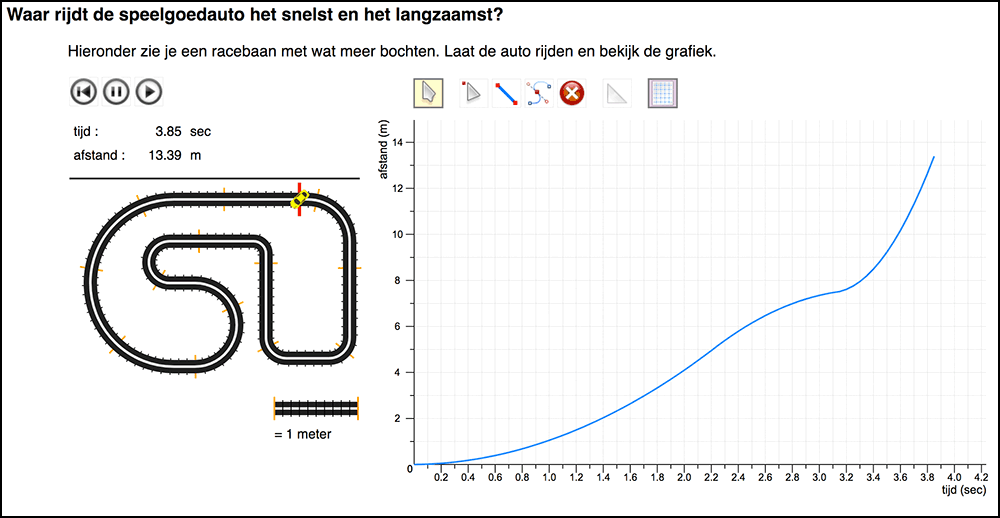
Then, the students would start exploring the situation quantitatively by measuring instantaneous speed at various points. We initially planned to deepen their emerging quantitative understanding by having them draw speed-volume graphs, followed by tasks to reconstruct the shape of a glass on the basis of its speed-volume graph. However, when trying out this learning trajectory in a mixed 5th/6th grade gifted classroom with an experienced teacher, we observed that the students seemed to become bored with filling glasses in the third lesson. As we had planned one-on-one teaching experiments in between lessons four and five to explore students’ conceptions of speed in other contexts, we decided to alter the fourth lesson by including these activities about other contexts: toy-car racing and daily temperature. (Figure 6).
We realized, however, that to determine speeds in those contexts the students had to be able to work with the tangent line on a curve. We conjectured that by combining the highball-glass-tool and a tangent-line-tool, the students would come to see that the tangent line in a point of the graph corresponds with the linear graph of the speed in the virtual highball glass (Figure 7). Then we expected the students to be able to use the tangent-line as an indicator of the speed at a point of a graph even when the graph is shown without the realistic simulation.
Observations, reflections, and revisions
The first instructional activities were intended to lead the students to coordinate two quantities, but, as a side effect, they made the students think about change in terms of the hash marks on a measuring cup, height differences, and intervals. This discrete approach to change was being reinforced by the way the teacher approached whole-class discussions about computing speed in the highball glass. She wanted the students to mark measurements from a table as points of the graph first before connecting the points with straight lines even when some students argued to draw a straight line immediately. She led the class to focus on determining speed on small intervals, without discussing what a computed speed actually meant. Thus, when the highball glass was replaced by the cocktail glass, the students interpreted this situation in terms of a series of discrete changes. They had trouble matching that perspective with the continuous changing speed in the cocktail glass.
It showed that already at the end of the first lesson the students realized that the speed in the cocktail glass and highball glass are the same when they have the same width. As anticipated, this allowed the students to invent the virtual highball glass as a measure for instantaneous speed. Linking the highball-glass-tool directly with the tangent-line-tool in the computer simulation (as shown in Figure 7) seemed to enable the students to determine instantaneous speeds in the cocktail glass, although the extent of their understanding of the tangent line and its relation with speed remained unclear.
In the context of toy-car racing, the students were able to interpret the graph, and most could compute the instantaneous speed using the tangent-line tool. However, the concept of instantaneous speed was not discussed. Moreover, we suspect that the students’ skill in using these tools to compute instantaneous speed was mostly procedural in nature and not an expression of a deeper understanding of instantaneous speed.
Chunky thinking
During the first three lessons, the students displayed what Castillo-Garsow, Johnson & Moore (2013) denotes as a chunky way of thinking, which was promoted by both instructional sequence and teacher. Castillo-Garsow (2012) introduced the concepts ‘chunky’ and ‘smooth’ to characterize two different forms of reasoning. Thinking about change in terms of intervals, or completed chunks, is called ‘chunky’. Students with a chunky image of change see change on an interval as the end-result of change on that interval. Students who see change as a continuous process have a ‘smooth’ image of change (Castillo-Garsow, 2012; Castillo-Garsow et al., 2013). Smooth thinking is fundamentally different from chunky thinking, and chunky thinkers will have trouble thinking about change as a continuous process. Contrariwise, thinking in terms of chunks, however, is apparently relatively easily achievable from a smooth perspective (Castillo-Garsow et al., 2013).
We may briefly summarize what we learned:
- We became even more aware that the power of the context of filling glassware lies in the fact that it offers the students a sound theory to reason about the covariation process on the basis of their understanding of the relationship between the width of a glass and the speed of the rising water.
- The students showed their implicit conception of instantaneous speed when answering the question, “When is the speed in the cocktail glass equal to the speed in the highball glass?” This was because this answer presupposes that one thinks of speed at a point.
- The students could handle the tangent-line tool, but we doubted their level of understanding.
- Further, they still did not manage to come up with a continuous graph. We inferred that starting with the highball glass might have put them on the wrong track.
Design experiment 2
3Chunky thinking is highly problematic because developing and reasoning about a smooth graph is a key element in the envisioned learning process. To overcome the problem of a discrete learning environment reinforcing discrete thinking, we decided to change the LIT for design experiment 2 to let the students’ learning process revolve around the non-linear situation of filling the cocktail glass. In this we also followed Stroup (2002), who argues that linear situations might be too simple to support students' developing understanding of calculus-like topics. We also removed the measuring cup activities because these invited students to focus on interpreting a continuous process in a discrete manner.
Modeling-based learning
To increase conceptual discussion about speed we opted for a modeling-based learning (MBL) approach. An MBL approach aims at getting access to the students’ thinking by having them express their understanding in visual or ‘expressed’ models (Coll, France, & Taylor, 2005; Gilbert & Boulter, 1998). An expressed model can be presented, discussed, and evaluated in class, allowing students to refine their models, while giving the teacher (and researchers) indirect access to their thinking.

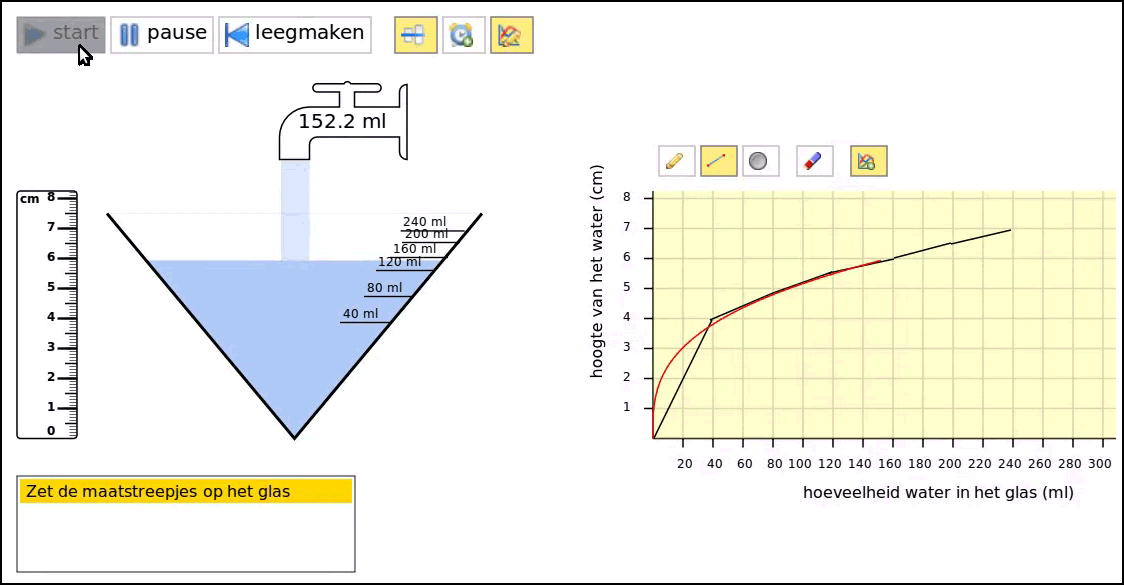
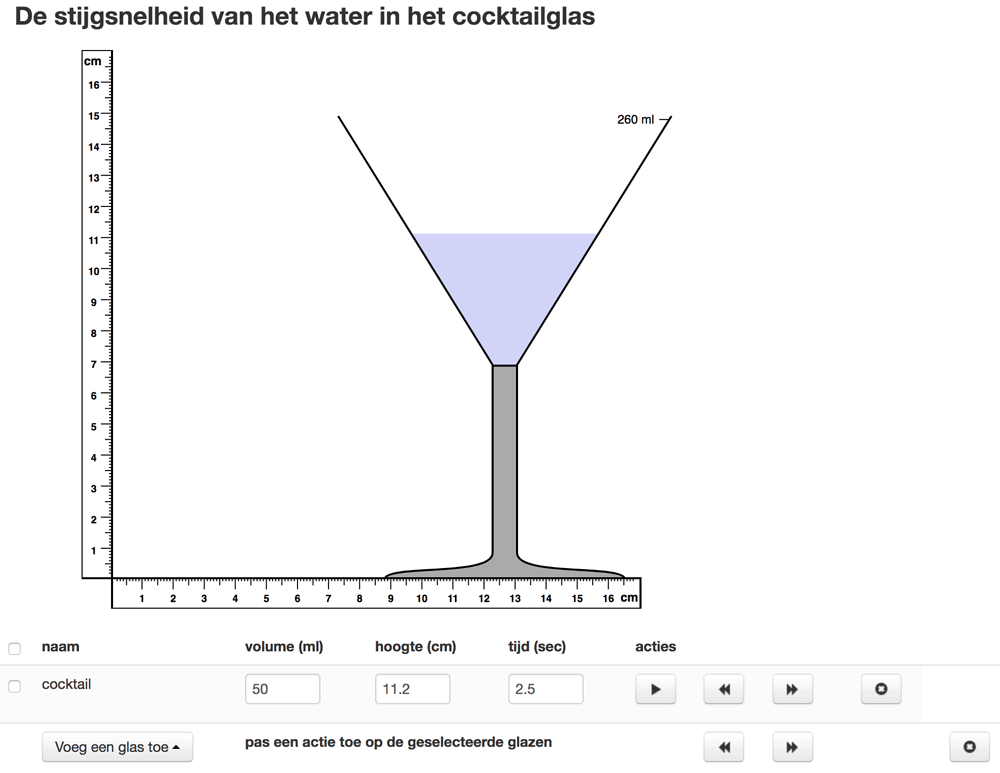
We redesigned the conjectured learning trajectory with a MBL approach in mind. We would ask the students several times to model the speed with which a cocktail glass fills up, and to improve their models. We expected the students’ first models to be quite realistic depictions of the situation (Schwarz, 2009), and these would be the starting point to support the students in developing more mathematical models. When these first models would be evaluated by running the computer simulation (Figure 8), we expected the students to be surprised by the non-linear nature of the situation, but immediately realize why the glass fills up the way it does. When asked to make a new model, we expected them to express the non-linear nature of the situation by coordinating water height and time. Next, in order to shift the students’ attention toward quantitative coordination of water height and time, we would ask them to create a model to predict the water height at certain moments. We expected them to create more precise models by using the simulation to measure the situation and use these measurements to annotate their models.
Then we would shift to a brief exploration of the speed in a highball glass. We expected students to be able to depict filling the highball glass, to explain why this graph is a straight line, and to compute the constant speed. Next, the students would be guided towards construing the highball glass as a tool for measuring instantaneous speed by exploring when the speed is the same in both glasses. Building on that realization, the students were expected to come to see that the curve of the cocktail glass is as steep as the straight line of the highball glass at that point. Finally, we would explore if the students could use this understanding in the context of toy-car racing. We expected the students to explain a race given a graph, indicate where the car went fastest or slowest, and use the tangent line to quantify its speed.
Observations, reflections, and revisions
Modeling-based learning
We tried this conjectured learning trajectory in a small-scale teaching experiment with four grade 5 students; the first author acted as a teacher. The MBL approach was a success with respect to generating more conceptual discussion about speed. Modeling helped students and teacher alike to express and discuss their thinking in more detail. There was ample room to explore alternatives. The students had some difficulty with combining the graphs of the cocktail glass and the highball glass. Eventually, they figured out that they had to draw a line through the appropriate point of the cocktail-glass graph, parallel to the highball-glass graph. This offered a basis for introducing the tangent line, and most students were able to determine the instantaneous speeds in the cocktail glass by using the tangent line.
In this manner, the students developed a deeper qualitative understanding. Their quantitative understanding of instantaneous speed lagged behind, however. Although they were able to use numerical procedures to compute speed, their ability in applying these procedures was limited. Students’ prior understanding of speed as a ratio of distance over time appeared less well developed than anticipated. Furthermore, students’ command of units and quantities was touch-and-go. We concluded that as primary-school students’ prior understanding is under-developed, we would have to pay more explicit attention to units, quantities, and computing speed as part of the learning trajectory.
Students appear inherently chunky thinkers
The other main change to the LIT did not work out as we had hoped. We had conjectured that starting the exploration of speed with the cocktail glass and skipping the measuring cup activities would steer students away from discrete thinking and make it easier to interpret filling glassware as a continuous process. However, despite the fact that the students seemed to realize that the speed changed continuously, their models still reflected a discrete perspective. And when the students tried to incorporate more quantitative aspects, their models became even more discrete. This appeared to fit the characterization of chunky thinkers by Castillo-Garsow (2012). We therefore conjectured that students of this age might be chunky thinkers who have to be supported to in making the switch from discrete to continuous thinking about speed.
We may briefly summarize what we learned:
- The modeling activity did help to make the students’ thinking visible and a topic of discussion.
- The students showed a lack of understanding of, and fluency with, measures of speed.
- There was still no success in developing continuous graphs: we conjectured that students of this age may be chunky thinkers.
- However, the students construed the tangent line to the cocktail glass curve parallel to the graph of the highball glass as an indicator of the speed at a given point.
Design experiment 3
4This section, in particular the vignette, is partially based on the results presented in Beer et al. (2015).
Working towards continuous graphs
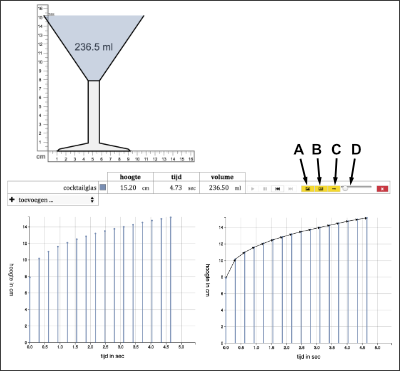
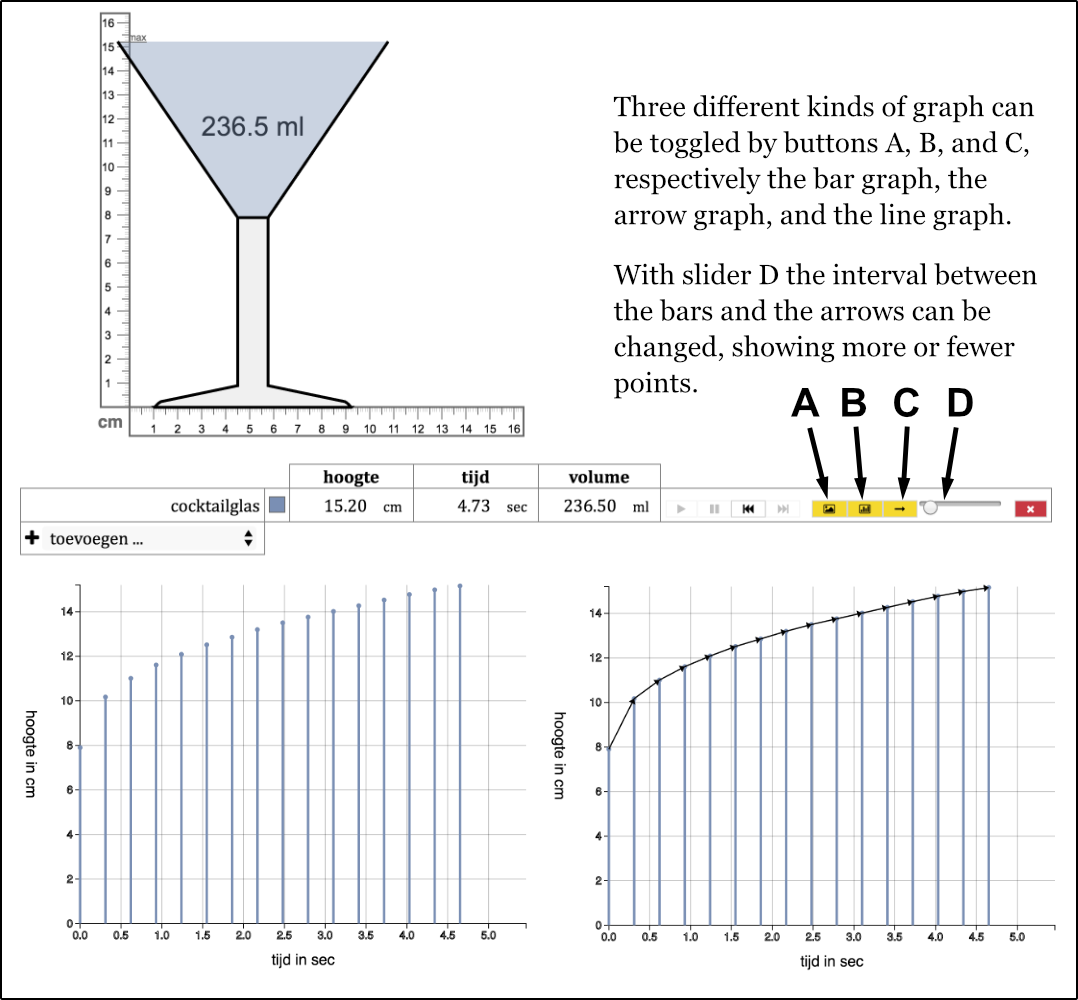
We decided to start again by asking the students to explore the glass-filling context by repeatedly modeling how the cocktail glass fills up. Then, instead of just introducing the curve, we added two activities to support students in developing the continuous graph by building on their own models. First, the students would be asked to draw on paper a minimalist model by taking one of their previous models as a basis and removing those characteristics that were not absolutely necessary to describe the situation. We expected them to make a step towards more abstract discrete models by removing realistic elements such as glasses and water sources. Then, based on these minimalist models, the teacher would guide the students to adapt their models to become increasingly graph-like representations, starting with a bar graph, followed by an arrow graph, leading up to a continuous Cartesian graph. The bars in the bar graph would come to signify water heights at specific moments, and arrows connecting the end points of the bars would come to signify change. Figure 9 shows that these three different types of graph can be toggled by buttons A, B, and C. With slider D the interval between the bars and the arrows can be changed, showing more or fewer points. In this phase, we expected the graph—as a model—to still derive its meaning for the students from its reference to the actual situation. Reflecting on computer-drawn continuous graphs and student-generated graphs in relation to the shape of the glass, we expected the students to come to see the curve as signifying both the changing value and the instantaneous speed.
Quantifying speed
Following the introduction of the curve, we would continue with the exploration of quantification of instantaneous speed by introducing the highball glass and asking the students to draw its graph on paper. Here, the teacher would activate the students’ prior knowledge of computing speed by explicitly referring to familiar notions of speed as distance over time before moving towards computing the rising speed in the highball glass. By paying attention to the quantities and the units involved, we expected the students to become better aware of what speed means in this situation. Through exploring speeds in various highball glasses, the students would become familiar with computing speed.
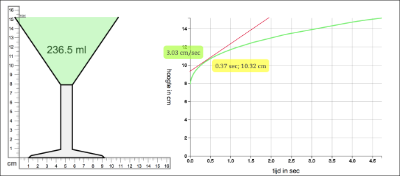
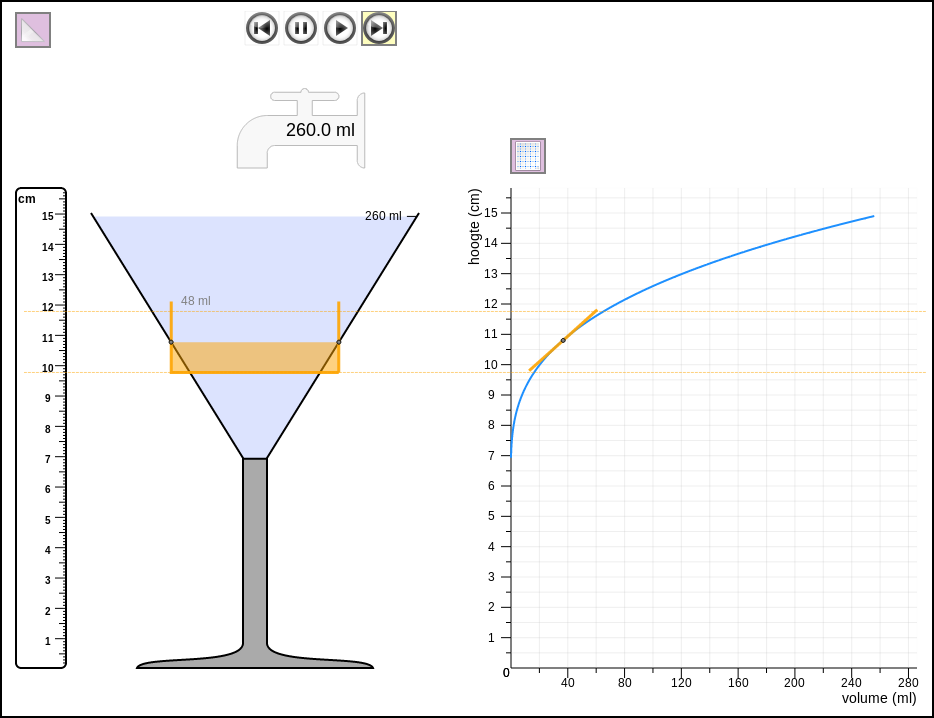
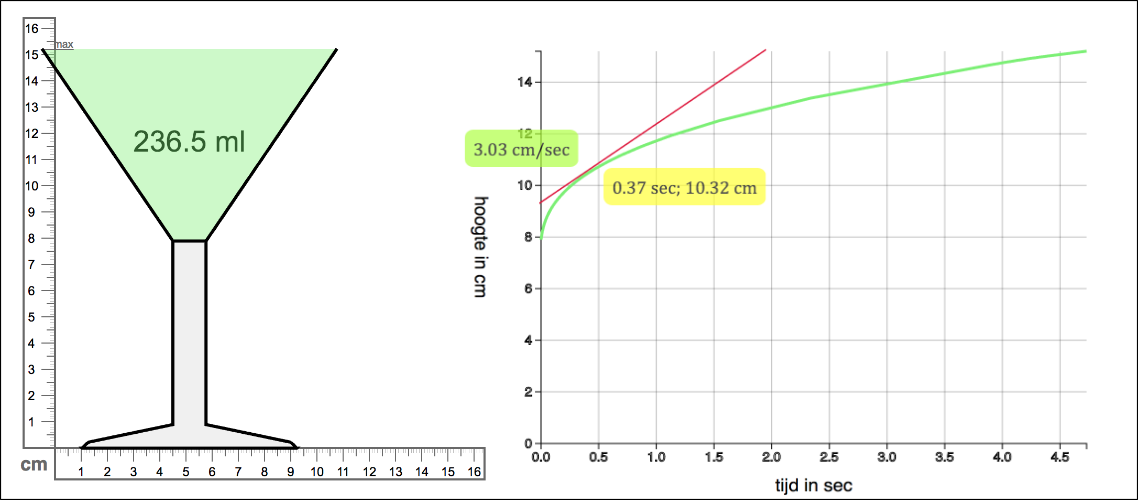
Building on the students’ understanding of the relationship between the width of a glass and speed, they would be guided to invent the highball glass as a tool for determining the instantaneous speed in the cocktail glass. Next, this understanding would be expanded by linking the graph of the highball glass to the steepness of the curve of the cocktail glass at the point where both glasses have the same width. Then the tangent-line tool would be introduced as a means for measuring instantaneous speed (Figure 10).
Next, we would switch to the familiar context of cooling and heating of water. The students would be asked to graph what happens when a glass of hot water cools down or a glass of ice-water warms up. After discussing these graphs, we would ask students to repeatedly measure the temperature at several moments and to compute the differences with the previous measurement and the room temperature, followed by computing the cooling speed and predicting when the cooling process will be finished. We expected them to improve their first models and to be able to point out where the temperature of the water cools down the fastest and why that is. Thus, we expected them to reinvent a qualitative version of Newton’s law of cooling.
Observations, reflections, and revisions
Students constructing continuous graphs
We translated the conjectured learning trajectory into an instructional sequence and tried it in two mixed 4th-6th grade gifted classrooms taught by the same teacher. A month after the first three lessons about filling glassware, a fourth lesson was taught about cooling and heating. Each lesson was first taught in classroom 1 (C1) on Fridays and then, after the weekend, in classroom 2 (C2).
The first lesson went in a similar manner as in design experiment 2: the students created increasingly more discrete models. When the students were asked to create a minimalist model in the next lesson, there was one pair of students in each classroom that created a graph-like model.
In C2, the students did need the guidance of the teacher—as we had anticipated. Building on a discrete visualization of the filling process, the students in C2 became focused on individual water heights—which obscured the bigger picture of how the rising speed changed over time. In C1, however—where a segmented-line graph functioned as a starting point—the students developed an adequate representation of continuously changing speed as an improvement of a given straight line graph, as shown by the following vignette.
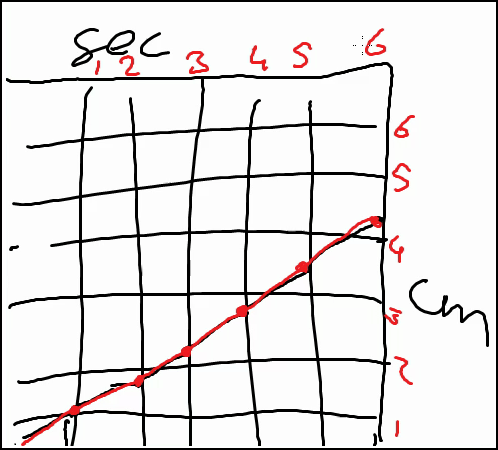
The teacher invited several pairs to present their minimalist model in front of the class. One of these models was a graph-like model (Figure 11). This involved an exchange in which the students clarified their graph, and the teacher labeled the axes with units and numbers and emphasized the graph by drawing it again in red.
Then, after a short detour discussing other students’ models, the teacher returned to this graph-like model and asked a student (Eric) if he could find the rising speed in the graph.
Eric: No.
Teacher: Why not?
Eric: Because it's slanted and it's slanted like that the whole time.
Teacher: And that fits with this, with this, this glass?
Eric: No.
Teacher: No, right? And how should it go then, you think? Eric, or Larry.
Larry: I think it should go a bit bent.
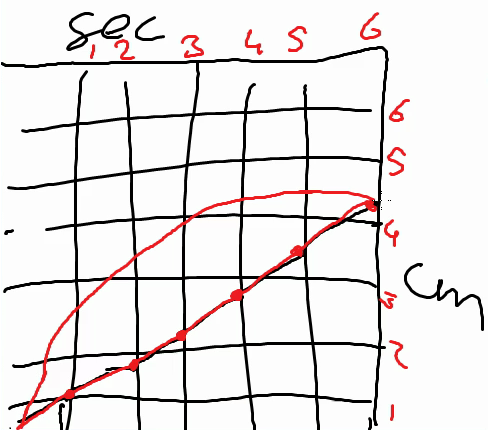
While drawing a curve in red on top of the graph (see Figure 12), Larry explained that at a certain moment the graph almost does not rise any more. When the teacher asked if everyone understood what Larry was doing, they answered yes; Jessica explained as follows.
Jessica: Yes, because it is bent, you can have it go, yes, steeper, so you can specify that it goes slower all the time. Because in the end, it has to go to the right.
Teacher: But, where, where, in what part of the graph it rises the fastest, for example?
Timothy: In the beginning, at the bottom.
Teacher: Yes, in the beginning, here at the bottom. But why, how can you see that?
Timothy: Well, because there, it goes up.
Teacher: But here (teacher points to a part of the graph at two thirds of the length of the graph) it does also go up.
Timothy: Yes, but it goes a little less higher.
Teacher: Less higher?
Timothy: Yes, less fast.
Students are smooth thinkers, but fall back to discrete models
We explored this unexpected difference between the two classrooms in detail in Beer et al. (2015), where we concluded that although classroom conditions often gave rise to the invention and use of discrete representations, the underlying conception that the students reasoned from was continuous. Various facts substantiated our conjecture that the students came to the classroom with a continuous conception of speed:
- The students quickly realized that the speed was continuously decreasing because of the increasing width of the cocktail glass’s bowl, when they saw a cocktail glass fill up.
- The students spoke about their realistic drawings or snapshots models as descriptions of a process.
- The ease with which the students came up with snapshots suggested that students were familiar with the idea of using discrete snapshots to visualize change over time.
- The students effortlessly accepted the curve, once it was introduced, which could be explained by assuming that the continuous model matched their existing continuous conception of the situation.
- After having seen how a discrete graph approached a curve when decreasing the interval between points, the students never referred back either to the bar graph or the arrow graph in later lessons.
- Finally, the students in classroom C1 developed a continuous curve by themselves because they were dissatisfied with the discrete and linear graph.
Procedural understanding and quantification
With regard to primary school students’ superficial notion of quantification, the teaching experiment of design experiment 3 further showed that the students were able to quantify speed with the help of the teacher. However, their quantitative understanding never seemed to exceed the ability to execute a procedure to compute speed. Apparently, the quantities, the units, and the measurements were not meaningful to them, and did not transcend the level of numbers in a calculation.
Finally, with respect to the flexibility of the students’ understanding of instantaneous speed, the way the students reasoned in the context of cooling and heating was similar to that in the context of filling glassware. They were able to represent their understanding of a situation in a graph and could interpret a graph in light of the situation. They were able to point out when the speed was highest or lowest, and could use the tangent-line-tool to measure instantaneous speed.
We may briefly summarize what we learned:
- The students in C1 were able to invent a continuous graph by themselves, by using their understanding of the relationship between the width of a glass and speed, and thus of the character of the covariation. Therefore, they are not chunky thinkers; they are continuous thinkers who have difficulty with graphing!
- Although starting discretely, the students in classroom C2 came to understand the continuous graph through shrinking the intervals of a bar chart.
- The students construed the tangent line as an indicator of the speed at a given point. (We see this as a tangent line; the students however were not yet familiar with that notion.)
- Students came to understand the shape of the graphs of a cooling process as being predicted by the tangent line that depended on the temperature differences.
- Students did not have a sound basis for calculating speeds: they did not really understand average speed, and they had a limited understanding of the measurement units. They need more experience with quantifying constant speeds in a variety of ways (with different units), and relating those with the corresponding graphs.
The yield and trackability of our learning process
vWe argue that the instructional sequence we tried in the last teaching experiment worked rather well although the students’ weak understanding of measuring speed clearly was a limiting factor. On the other hand, the invention of the curve as a better representation of the process of filling a cocktail glass surpassed our expectations. If we adjust for these two aspects we may describe the prototypical instructional sequence emerging from the last teaching experiment as follows:
- Students model the process of filling a cocktail glass.
- Supported by a computer simulation, students develop a minimalist model of this process on paper. This explicates the underlying process: the wider the glass, the slower the water level rises.
- Students work towards conventional graphs that are known to them: bar graphs and segmented-line graphs.
- Students are supported in inventing the continuous and curved line graph as the best representation of the cocktail glass’
filling process by
- critiquing the segmented graph and
- increasing the number of bars in the bar graph with a computer tool.
- Students explore the highball glass, its linear graph, and its constant speed with the computer tool (that can show a simulation of the filling process, and has the option of showing the corresponding graph); by investigating highball glasses with various widths, and by varying the measurement units.
- Students discuss the question: “When are the speeds in a cocktail glass and a highball glass the same?”
- Students are introduced to and work with a virtual highball glass in the computer simulation.
- Students compare the graphs of the cocktail glass and the highball glass; they figure out that a straight line that touches the cocktail glass curve at the point where the widths of both glasses are the same is parallel to the highball glass graph, and it signifies the speed at that point.
- Students investigate the tangent line as an indicator of speeds in various points of a graph; both static at a given point, and dynamic moving along the graph.
- Students generalize their understanding of instantaneous speed and graphs towards heating and cooling of water.
The development of this prototypical instructional sequence was illustrated in the previous section in terms of our own learning process, which encompassed both the design decisions and the rationale for those decisions, and thus also described the emerging LIT. To avoid too much overlap, we will not reiterate this LIT here in detail, but summarize the most important theoretical findings. We formulate such a LIT elsewhere in detail (Beer, 2016).
- Key is the thesis that the students are spontaneously thinking in terms of instantaneous speed from the start. This conception allows the students to come up with ‘equal widths’ as the answer to the question, “When is the speed in the cocktail glass and the highball glass the same?” This also fits with the students’ quick understanding of the constantly decreasing speed in the cocktail glass, and with the intuitive appreciation of the curved continuous graph. It also enables the students to reinvent the continuous graph by arguing that the graph of filling a cocktail glass cannot be linear because the rising speed is diminishing all the time. Thinking of speed as instantaneous speed, and realizing that the speeds are the same at the point were two glasses have the same width, enables them to use the virtual highball glass as a means of establishing the speed at a given point in a cocktail glass.
- When asked to imagine filling a highball glass, the linearity of the relationship between water level height and volume is self-evident for the students, which they effortlessly express with a linear graph. As the students have little understanding of average speed, we may assume that they think of constant speed in connection with a linear process. This understanding is powerful enough to help the students construe the tangent line as an indicator of the speed in a given point: by combining the graph of the cocktail glass and the graph of the virtual highball glass. Unfortunately, their understanding of, and fluency with measures for speed hinders the opportunity to subsequently quantify instantaneous speed. However, they understand the tangent-line tool well enough to link the difference between the actual and the final temperature to the tangent line in a cooling process, and explain the cooling graph in this manner.
These theoretical findings offer the rational underpinning of the prototypical instructional sequence. They can be taken as conjectures on how students in other classrooms may reason. In this manner, they offer a framework of reference on the basis of which teachers may adapt the instructional sequence to their own needs and their own classrooms. In addition, they offer support for instruction design, and for new design experiments and further theory development.
Reflections on our learning process with respect to educational design
viIn the previous sections we have elaborated on the learning process of the researchers/designers. When reflecting on this learning process from an instructional design perspective, we may discern a series of design decisions that were reflexively related to this learning process.
The first design decision concerned the choice for social-constructivism and RME theory. For us, the choice of this theoretical framework was self-evident and a rather implicit decision. From early on, guided reinvention was part of the design process. Our aim was to support the students in building on, and extending, their own understanding of speed. We further oriented ourselves towards historical conceptions of speed. The choice for the context of filling glassware was partially motivated by the didactical phenomenology heuristic. In our search for an application of speed that would be experientially real to the students, we came across this context. In both the literature and primary school textbooks we found indications that students would be able to easily connect their intuitive understanding of this situation with graphs. We especially appreciated the fact that the student's understanding of the filling process would offer them a basis for reasoning about the changing speed of rising. In a sense, they would have a theory to underpin their reasoning about the co-variation.
The next design decisions concerned the choice to start with a series of one-on-one teaching experiments—we found our knowledge about the potential starting points of the students was wanting— and our subsequent decision to start the first design experiment by repeating the activities of the one-on-one teaching experiments. In addition, we decided to ask the students to tell us when the rising speed in a cocktail glass and a highball glass would be the same, because we saw great potential in linking the speed at a given height in a cocktail glass with the speed in a highball glass of a corresponding width. A related design decision was to use this as a starting point for introducing the connection of the instantaneous speed at a given point in time with a linear graph, or a tangent line, through a corresponding point of a height-time graph. For this we designed a computer tool. Finally, the graph and the tangent line became an independent object of investigation. Time constraints, however, did not allow for a thorough investigation of this idea.
Guided by the conjecture that the students were chunky thinkers (in accordance with Castillo-Garsow, 2012), we decided in design experiment 3 to support students in switching to a continuous perspective by starting with the cocktail glass, and to follow a MBL-approach (Coll et al., 2005) in order to get more insight in the students’ thinking. The students showed how the insight that the rising speed was constantly changing leads to the conclusion that there cannot be a straight part in the graph. This reasoning of the students created the need to take a fresh look at our design. The way that the students argued for the curve, as an improvement over the segmented-line graph, was in conflict with our implicit assumption that the students had some form of average speed in mind when they spoke about speed. After reexamining our data we concluded that the students did not speak of, or reason with, average speed, but reasoned from an informal conception of instantaneous speed. Thus their intuitive notions of speed were continuous, but they lacked the representational competency to model it with continuous models, and therefore resorted to discrete snapshots models (Beer et al., 2015). This put the idea that the students were chunky thinkers in a different light.
From the RME perspective we may observe that our learning process also helped us to sharpen our ideas of how the emergent modeling heuristic could be developed further. We realized that the snapshot pictures of water heights and discrete height-time graphs initially signified a series of water heights for the students. Simultaneously, with the support of the teacher and the instructional activities, the subsequent graphical representations started to come to signify speeds of rising—indicated by the curvature of the slope of the graph. Key elements in this process concerned,
- the students' understanding that speeds in two glasses would be equal at the point where the widths were equal, which
- gave us a starting point for introducing the connection of the instantaneous speed at a given point in time with a linear graph, or a tangent line through a corresponding point of the height versus time graph, and
- the students' invention of the continuous graph.
This, however, did not change our initial insight, that it would require more than a few lessons to develop instantaneous speed as an object-like conception that would derive its meaning from a network of mathematical relations. That would be the goal of emergent modeling in this case. We may add that this also holds for doing justice to the didactical phenomenology design heuristic.
Discussion
viiEven though some of those findings reflect what is already known about what students can do and how they are taught in regular classrooms, we believe that the findings as a whole offer a new and exciting perspective on what and how primary-school students may learn about speed. Their insight in what determines the rising speed in a glass, and their implicit conception of speed as an instantaneous speed that may change continuously, can be exploited by supporting various forms of graphing, in order to develop a deeper understanding of speed that may evolve into understanding speed as a rate.
As a caveat we may note that these claims are based on observations of how the students acted and reasoned during the design experiments. Our interpretations of those observations fed into either the next activity or the next experiment, which resulted in micro-design and macro-design cycles that had strong similarities with an empirical cycle of hypotheses testing. We can, however, only make claims about the students who participated in our experiments. Even then we have to take care to carefully ground our claims in the observational data. That is, we have to make sure that our conclusions are valid for the majority of the students in the class and not just a few, which is not always easy as not all students speak up during classroom discussions. Here it is important to determine what the social norms in the classroom are. We have to know whether the students are likely to speak up when they disagree or do not understand what is going on. We judged that this was predominantly the case in the classrooms where the experiments were carried out.
In addition to the micro-design cycles that immediately contribute to the learning process of the researchers, one usually also carries out a retrospective analysis after the experiment is concluded. Here Glaser and Strauss’ (1967) method of constant comparison is the designated method. We presented an exemplary elaboration of this method for design experiment 3 in Beer et al. (2015). Note that the results of this procedure limit themselves to statements about the actual design experiments. Glaser and Strausss‘ (1967) method does not answer the question whether those results are generalizable. On the basis of those findings, however, a design experiment can be treated as a paradigm case. The goal then is to come to understand the specific characteristics of the investigated learning ecology in order to develop theoretical tools that make it possible to come to grips with the same phenomenon in other learning ecologies. Instead of a scripted lesson plan, the LIT offers a theory of how the intervention works, which teachers and instructional designers can adjust and adapt. To be complete, we should add that design research may also aim at developing theories—or theoretical tools—on more encompassing issues that transcend the LIT, such as ‘classroom social norms’, or ‘symbolizing’. In such cases, the learning ecology that is created serves as a condition for research on this more encompassing issue.
References
viiiAbell, P. (2004). Narrative Explanation: An Alternative to Variable-Centered Explanation? Annual Review of Sociology, 30, 287-310. Retrieved from http://www.jstor.org/stable/29737695
Barab, S. A., & Squire, K. (2004). Design-based research: Putting a stake in the ground. Journal of the Learning Sciences, 13(1), 1-14. Retrieved from http://citeseerx.ist.psu.edu/viewdoc/download?doi=10.1.1.128.5080&rep=rep1&type=pdf
Bock, D. de, Dooren, W. van, Janssens, D., & Verschaffel, L. (2002). Improper use of linear reasoning: An in-depth study of the nature and the irresistibility of secondary school students' errors. Educational Studies in Mathematics, 50(3), 311-334.
Castillo-Garsow, C. (2012). Continuous Quantitative Reasoning. In R. Mayes, R. Bonillia, L. L. Hatfield, & S. Belbase (Eds.), Quantitative reasoning and Mathematical Modeling: A Driver for STEM Integrated Education and Teaching in Context (pp. 55-73). Retrieved from http://www.uwyo.edu/wisdome/_files/documents/castillo_garsow.pdf
Castillo-Garsow, C., Johnson, H. L., & Moore, K. C. (2013). Chunky and Smooth Images of Change. Retrieved from http://yeolcoatl.net/research/2012_cwcg_chunky_and_smooth_endfig.pdf
Cobb, P. (2003). Chapter 1: Investigating Students' Reasoning about Linear Measurement as a Paradigm Case of Design Research. In Supporting Students' Development of Measuring Conceptions: Analyzing Students' Learning in Social Context (Vol. 12, pp. 1-16). Retrieved from http://www.jstor.org/stable/30037718
diSessa, A. (1991). If we want to get ahead, we should get some theories. In Proceedings of the Annual Meeting of the North American Chapter, International Group for the Psychology of Mathematics Education: Plenary papers (pp. 220-239). Retrieved from http://www.eric.ed.gov/PDFS/ED352274.pdf
diSessa, A., & Sherin, B. L. (2000). Meta-representation: an introduction. The Journal of Mathematical Behavior, 19(4), 385-398. doi:10.1016/S0732-3123(01)00051-7
Fann, K. (1970). Peirce's theory of abduction. The Hague: Martinus Nijhoff. Retrieved from http://www.dca.fee.unicamp.br/~gudwin/ftp/ia005/Peirce%20Theory%20of%20Abduction.pdf
Galen, F. van, Gravemeijer, K., Mulken, F. van, & Quant, E. (2012). Kinderen ononderzoeken 'snelheid'. Retrieved from http://www.fisme.science.uu.nl/rekenweb/grafiekenmaker/documents/kinderenonderzoekensnelheid.pdf
Gravemeijer, K. (1999). How emergent models may foster the constitution of formal mathematics. Mathematical Thinking and Learning, 1(2), 155-177.
Gravemeijer, K., & Cobb, P. (2013). Design research from the learning design perspective. In N. Nieveen & T. Plomp (Eds.), Educational design research (pp. 73-113). Enschede: SLO. Retrieved from http://international.slo.nl/publications/edr/
Gravemeijer, K., & Doorman, M. (1999). Context Problems in Realistic Mathematics Education: A Calculus Course as an Example. Educational Studies in Mathematics, 39(1/3), 111-129. Retrieved from http://www.jstor.org/stable/3483163
Kaput, J., & Schorr, R. (2007). Changing representational infrastructures chages most everything: the case of SimCalc, algebra and calculus. In G. Blume & K. Heid (Eds.), Research on technology in the learning and teaching of mathematics (pp. 211-253). Mahwah, NJ: Erlbaum. Retrieved from http://www.kaputcenter.umassd.edu/downloads/simcalc/cc1/library/changinginfrastruct.pdf
Kelly, A. (2013). When is design research appropriate? In T. Plomp & N. Nieveen (Eds.), Educational Design Research (Vol. A, pp. 135-150). SLO. Retrieved from http://international.slo.nl/edr
Maxwell, J. (2004). Causal explanation, qualitative research, and scientific inquiry in education. Educational Researcher, 33(2), 3-11. Retrieved from http://citeseerx.ist.psu.edu/viewdoc/download?doi=10.1.1.117.4297&rep=rep1&type=pdf
Millar, R., & Osborne, J. (Eds.). (1998). Beyond 2000: Science education for the future. London: Nuffield Foundation; King's College London. See http://www.nuffieldfoundation.org/beyond-2000-science-education-future
Simon, M. A. (1995). Reconstructing Mathematics Pedagogy from a Constructivist Perspective. Journal for Research in Mathematics Education, 26(2), 114-145. Retrieved from http://www.jstor.org/stable/749205
Stroup, W. (2002). Understanding qualitative calculus: A structural synthesis of learning research. International Journal of Computers for Mathematical Learning, 7(2), 167-215. Retrieved from http://www.springerlink.com/content/k211l7w34v628740/fulltext.pdf
Swan, M. (Ed.). (1985). The Language of Functions and Graphs: An examination module for secondary schools. Shell Centre for Mathematical Education. See http://www.mathshell.com/materials.php?item=lfg&series=tss
About the Authors
ix
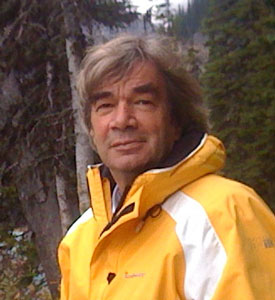
Koeno Gravemeijer is Professor Emeritus in Science and Technology Education at Eindhoven University of Technology in the Netherlands. Earlier he was professor in Mathematics Education at the Freudenthal Institute & the Faculty of Social Sciences at Utrecht University, and at Vanderbilt University. His research interests concern instructional design, design research, the domain-specific instruction theory for realistic mathematics education (RME), and students' use of symbols and modeling. In relation to the latter he developed the so-called 'emergent modeling' design heuristic. Next to his research activities, he also has been involved in instructional design. He has been the leading author of an RME textbook series for Dutch primary schools, and he was involved in the development of the textbook series for the American Middle School, "Mathematics in Contexts"-a collaborative project of the Dutch Freudenthal Institute and the University of Wisconsin-Madison.
Michiel van Eijck was Associate Professor at the Eindhoven School of Education (ESoE), the teacher education institute of Eindhoven University of Technology. His research interest were in the field of STEM education, and themes such as interdisciplinary education in science, place-based education, context-rich education and stimulating interest in science. He sadly passed away much too young in 2014 after having fought an aggressive form of pancreatic cancer.
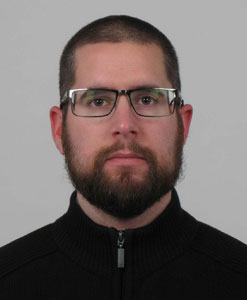
Huub de Beer is a historian, teacher, educational researcher, and computer science engineer. He has worked as a historian at the University of Amsterdam on a project aiming at detailing the Dutch computer pioneering period (1945-1965). Later on he became a high school teacher and taught computer science in grades 10-12 and ICT in grade 9. In 2016 he successfully defended his dissertation titled "Exploring instantaneous speed in grade 5. A design research". The findings of that PhD project are presented in this article. Currently, Huub de Beer is working as a computer science engineer at a high-tech company.
Acknowledgement & Copyright Note
1Some images in this article previously appeared in the ZDM paper de Beer, Gravemeijer & van Eijck (2015) and are reproduced here under the Creative Commons Attribution License. At the request of the authors, this Educational Designer article may also be distributed under the terms of the Creative Commons Attribution 4.0 International License – see creativecommons.org/licenses/by/4.0/.