
World Class Tests:
Summative Assessment of Problem-solving
Using Technology
Daniel Pead
Shell Centre for Mathematical Eduation
The
University of Nottingham
Abstract
i
This article considers how the principled design of
interactive, computer-delivered tasks can enable the assessment of
problem solving and process skills in ways that would not be
possible in a conventional test. The case studied is World Class
Tests, a project started by the UK government in 1999, which set out
to produce and deliver summative assessment tests that would reveal
“submerged talent” in 9 and 13 year-old students who were not being
challenged by the regular curriculum. There were two subjects:
“Mathematics” and “Problem-solving in Mathematics, Science and
Technology”; 50% of the test for each subject was delivered
on computer. This article describes the design and development of
the computer-based tests in problem-solving, and discusses some
implications for the current effort to increase the emphasis on
problem-solving and process skills in assessment. The author was the
lead designer for the project strand working on computer-based
problem solving tasks.
1. Introduction
1
How can technology contribute to the summative assessment of
problem solving skills – a requirement of the “Mathematical
Practices” in the US Common Core State Standards and many other
national curricula – in an otherwise conventional timed assessment?
As discussed in the ISDDE working group report in this issue (ISDDE, 2012), conventional
summative testing tends to promote tests comprised of many short,
closed items with multiple choice or short, constructed answers. The
economies of large-scale computer-based testing are biased in favour
of this model, despite its weakness in testing problem-solving. In
contrast, there are copious examples of rich classroom activities
using technology to develop process skills in mathematics and science
(see, for example: Boon, 2009,
Figueiredo, van Galen
& Gravemeijer, 2009). There are also efforts to produce
radically different types of summative assessment based on extended,
immersive, virtual reality investigations (such as the Virtual
Performance Assessment Project at Harvard). In this article we
consider a “third way” – computer-delivered tests comprised of
self-contained 5-10 minute tasks, more ambitious than the typical
test item, but more structured and closed than most “classroom
investigations”. In the novice-apprentice-expert model being
developed in the US in response to the Common Core Standards, most of
these would be classified as “apprentice” tasks (see section 2 of
ISDDE, 2012, in this issue).
The World Class Tests project had the freedom largely to
define its own syllabus and, specifically , to focus on problem
solving skills without the usual obligation to assess the wider
mathematics curriculum. On the other hand this project was required,
after an initial research phase, to deliver externally
marked assessments in quantity. These were published and administered by an
awarding body. This places it in a slightly unusual position between
pure “insight” research projects, which might study a few tasks in
great detail, and regular assessment production.
2. The World Class Tests project
2
The brief
The World Class Tests were the central part of the UK
government-funded World Class Arena programme, intended to provide
support for ‘gifted and talented students’. A particular focus was to
identify, engage and challenge those students whose ability might not
be apparent from their performance on day-to-day classroom activities
(so-called ‘submerged talent’).
The product, as originally conceived by the Government in 1999,
would consist of computer-delivered assessment tests for students at
ages 9 and 13, available ‘on-demand’ (requiring a bank of questions equivalent to producing four sittings per year).
Early in the tendering process, this was altered to include a mix of
computer- and paper- based tests, sat twice a year.
There would be two separate sets of tests: “Mathematics” and
“Problem solving in mathematics, science and technology”. This
article concentrates on the development of computer-based tasks for
the “problem solving” strand and the issues arising from this
process.
Educational principles
2
Although aimed at more able students, a key constraint of the
design was that the tasks should not require above-average
curriculum knowledge, but should focus on more sophisticated
reasoning and insight. This has resonance with some models of
functional mathematics/mathematical literacy, (see e.g. Steen, 2000). It was
therefore necessary to agree on a clear description of these
“process skills” and methods for ensuring that each test adequately
covered this aspect of the domain . Although there was no strictly
defined body of content knowledge which had to be assessed, each
test sitting was expected to include a range of topics from
mathematics, science and technology. The chosen solution was a
development of the “framework for balance” model devised by the
MARS Balanced Assessment project (Balanced Assessment, 1999). This approach is descibed in section 8 of
Swan & Burkhardt (2012)
in this issue.
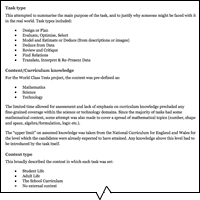
For the World Class Tests this was adapted to produce a
“Domain framework in mathematics and problem solving” (Bell & Burkhardt, 2003). The definitions
of problem solving adopted by the OECD PISA assessments (PISA, 2003) were also
referenced for this. The dimensions covered by this framework are
summarised in Figure 1a.
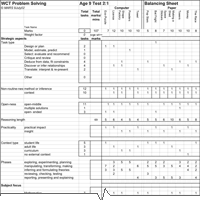
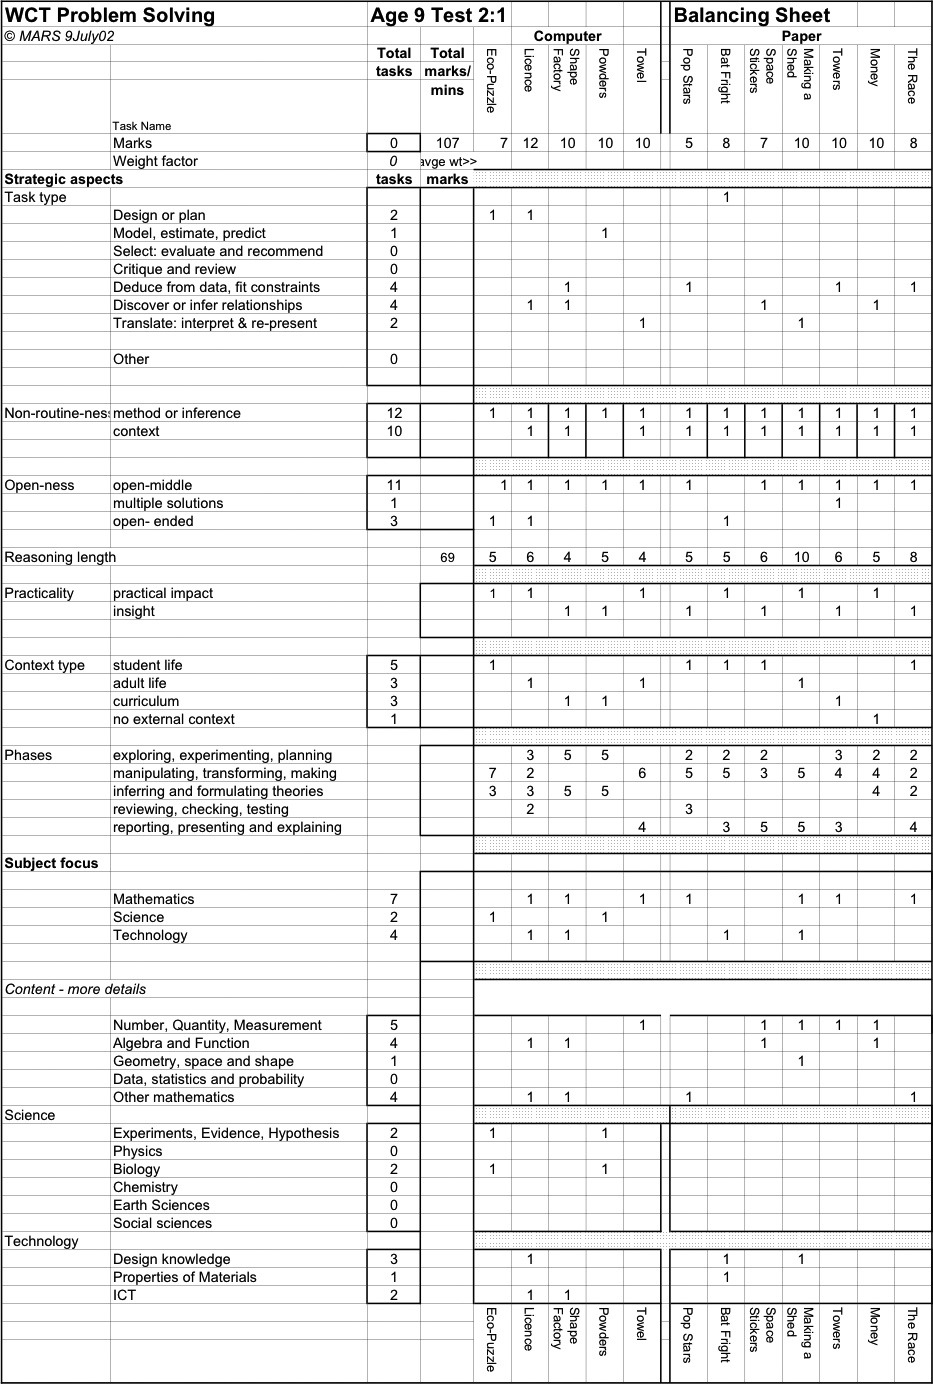
Tests were constructed and validated against the above domain
specification using an adaptation of the same “balancing sheet”
technique developed for Balanced Assessment. A sample
balancing sheet is shown in Figure
1b.
3. The role of the computer
3
Although the original brief called for an entirely computer-based
assessment, the consensus of the designers was that the “state of the
art” of computer-based testing and automatic scoring would require
highly structured questions with constrained response formats,
precluding the type of open-ended, unstructured tasks which are an
essential component of problem solving – and of the Balanced
Assessment philosophy. The arguments for this were similar to those
presented in the ISDDE
Working Group Report (ISDDE,
2012). QCA, the government agency, accepted this and it was
therefore decided that each test should consist of two parts – one
using pencil-and-paper and another delivered by computer.
In addition to the pencil-and-paper-only tests, the
computer-based tests would also be accompanied by a paper workbook.
For the mathematics tests, these were used purely to provide space
for rough working. In the case of problem solving, however, some
on-screen questions would instruct the students to write the response
in their workbook. This was seen as the only way that students could
respond to questions which required a description (possibly including
mathematical notation) or demonstrate that they could, autonomously,
choose to represent data as a chart or table without being given an
on-screen form which defined the format for them.
Although probably untenable in the long term for a “computer
based” assessment, this did provide a valuable interim solution as
task styles developed. It was also the only way that tasks could be
trialled in the early stages of the project, before the data
collection infrastructure was in place. Towards the end of the
project, as experience was gained by the designers, the dependence on
the answer books was waning. Had task development continued, the
answer books would probably have been dropped or, as with the
mathematics tests, relegated to “rough work” which would not be
marked.
The availability of the written paper-based tests meant that
the computer tests did not have to waste effort replicating tasks
that were known to work well on paper, and could concentrate on ideas
that exploited the computer to the full. The answer booklet for the
computer test meant that the computer could be used to present
contexts and information in an interactive format without sacrificing
the ability to ask less structured, investigative questions.
Qualities that made a task particularly suitable for use in the
computer-based component included:
- The use of animation or interactive graphics
to present concepts and information that would be hard to
communicate, in simple language, on paper;
- The provision of a substantial data set, for
students to explore with searching or graphing tools;
- Use of simulated science experiments, games
and other “microworlds” - allowing question types that would be
impossible on paper; and
- Other types of questions that were more
suited to computer than paper – for example, questions that
naturally suggested a “drag and drop” interface.
The main constraint was that the test was to be assembled from
self-contained, 5 to 15-minute tasks. Although such tasks are long
compared to those typically found on current mathematics tests, it is
quite short for the sort of open-ended investigations suggested by
the criteria above. As well as the direct limitation on task length,
this meant that any on-screen “tools” that the student was expected
to use within a task had to be extremely simple and intuitive to
operate, otherwise valuable assessment time would be wasted on
on-screen tutorials and practice before each task.
As the tests were to be scored and graded conventionally, each
task also required a systematic, summative scoring scheme so, even
without the constraints of capturing the answer on computer, there
needed to be a definite “outcome” against which performance could be
reliably assessed.
The other constraint was that tasks had to be produced in
significant quantities (over the course of the project, 110 computer
based tasks were developed, each representing 5-15 minutes of
assessment and usually involving some sort of interactive animation
or simulation). This limited the amount of software development
effort that could be devoted to an individual task.
4. Illustrative examples of tasks
4
One of the challenges for the problem solving strand was to cover
the field of “problem solving in science” without depending on much
prior knowledge of science – a particular problem at age 9. The
computer allowed the presentation of simulated science experiments
– in a simplified but defensible form – that embodied all the
required knowledge and left students to investigate, draw
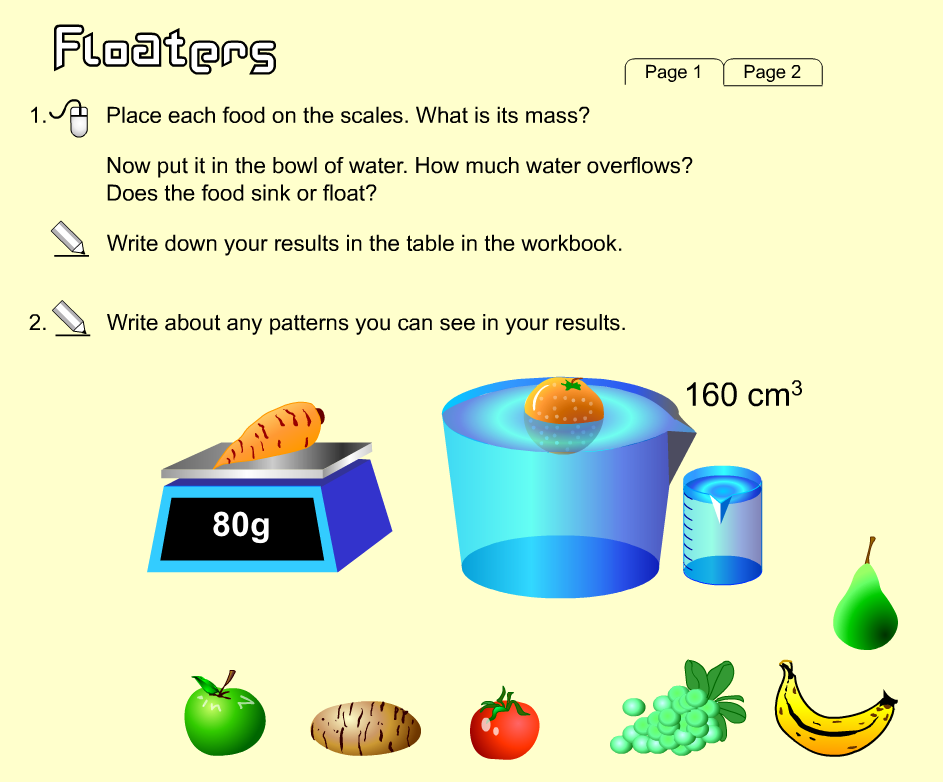
inferences and justify their conclusions. Figure 2 shows one example, which allowed
9-year-olds to successfully engage with the beginnings of
Archimedes' principle, eliciting insightful (if ungrammatical)
responses such as:
“All the vegetables and fruits that sinks
overflow less than they weigh. All the food that float overflow how
much they weigh.”
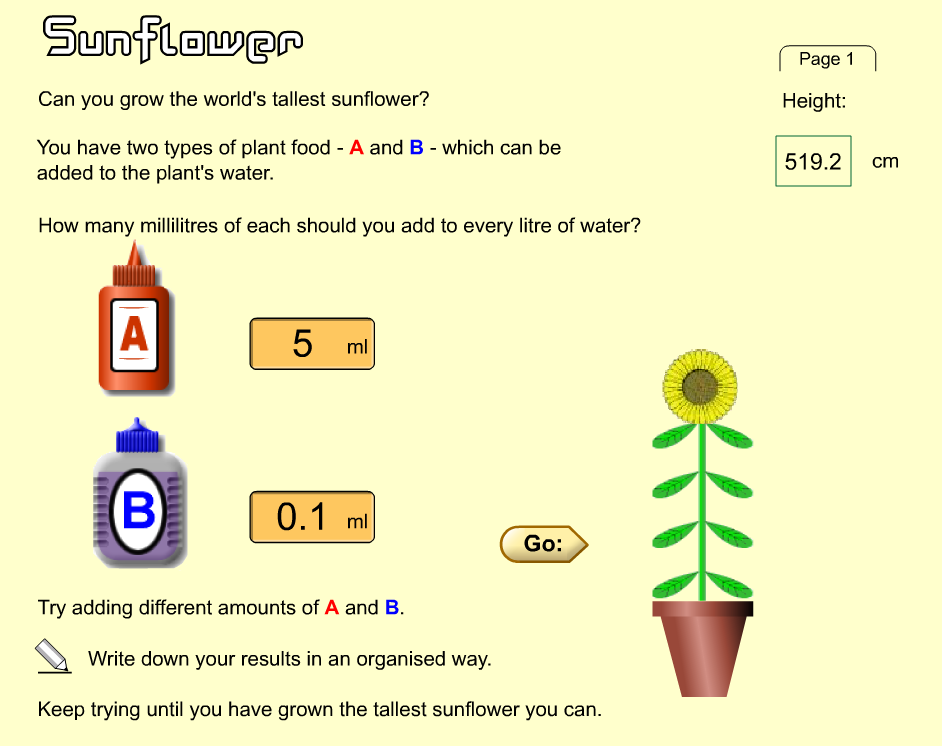
The task Sunflower (Figure
3) required students to find the optimum combination of nutrients
to grow a giant sunflower. Here the “science” content was imaginary
(although plausible) and the underlying task was to perform a
systematic search for a maximum, while showing the ability to work
with decimal fractions to 2 places.
Table 1 shows a “heuristic inference” scoring scheme for this
task, which allows fully automatic scoring based purely on the
amounts of “plant food” chosen by the student for their best
attempt.
| Amount of A and B for best height achieved |
Inference |
Score |
| 11 ≤ A ≤ 12 |
- Has held B constant while varying A
- Has tried 0 or <1 for B
- Has searched for maximum using integers +1
|
+1 |
| 11.0 < A < 12.0 |
- Has used decimal fractions.
|
+1 |
| 0 < B < 1 |
- Has used decimal fractions less than 1
|
+1 |
| 0.3 ≤ B ≤ 0.4 |
- Shows some sort of systematic search for B
- Has held A constant
|
+1 |
| 0.30 < B < 0.40 |
- Has gone to 2 decimal places. +1
|
+1 |
| A = 11.5, B = 0.36 |
|
+1 |
Table 1: “Heuristic inference” scoring
for the Sunflowers task
Mathematical games
1
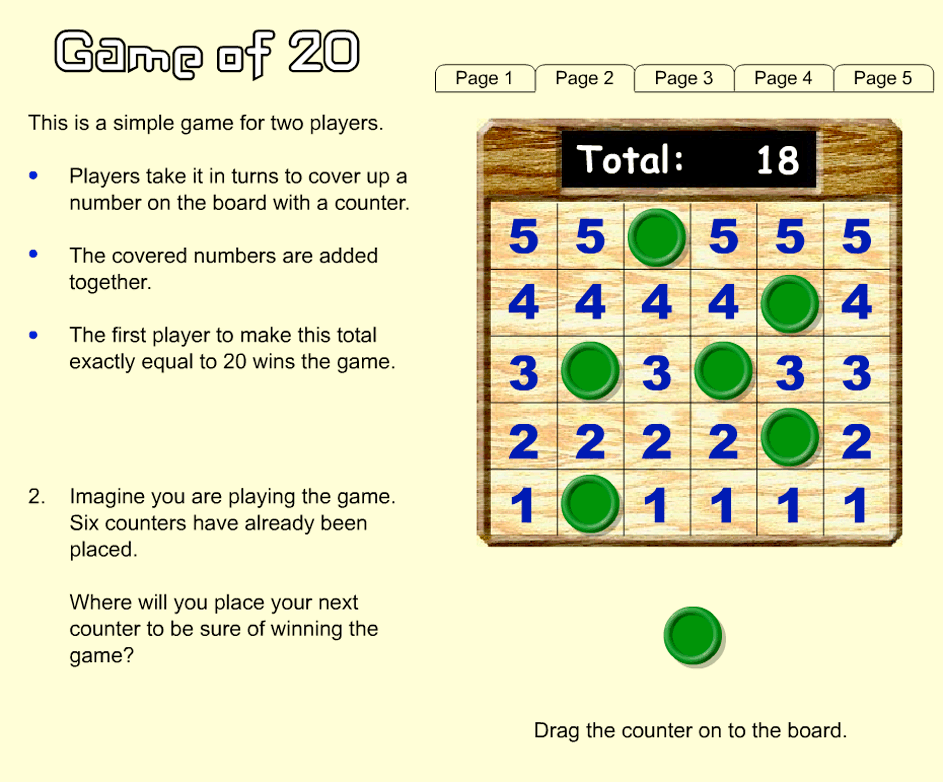
The tests were not limited to “real life” problems and
included several “Number games” such as the example in
Figure 4. This type of game
(a variant of “Nim”) has the advantage that there is an easily
accessible optimum strategy. However, it was soon clear that
leaping directly to formulating the strategy was beyond the ability
of most students, so these tasks typically fell into the pattern:
- Here are the rules – play a few games against the
computer.
- Here is the last stage in a sample game – identify
the winning move.
- Here is another sample game – identify the two moves
needed to win.
- Now describe the strategy for always winning the game.
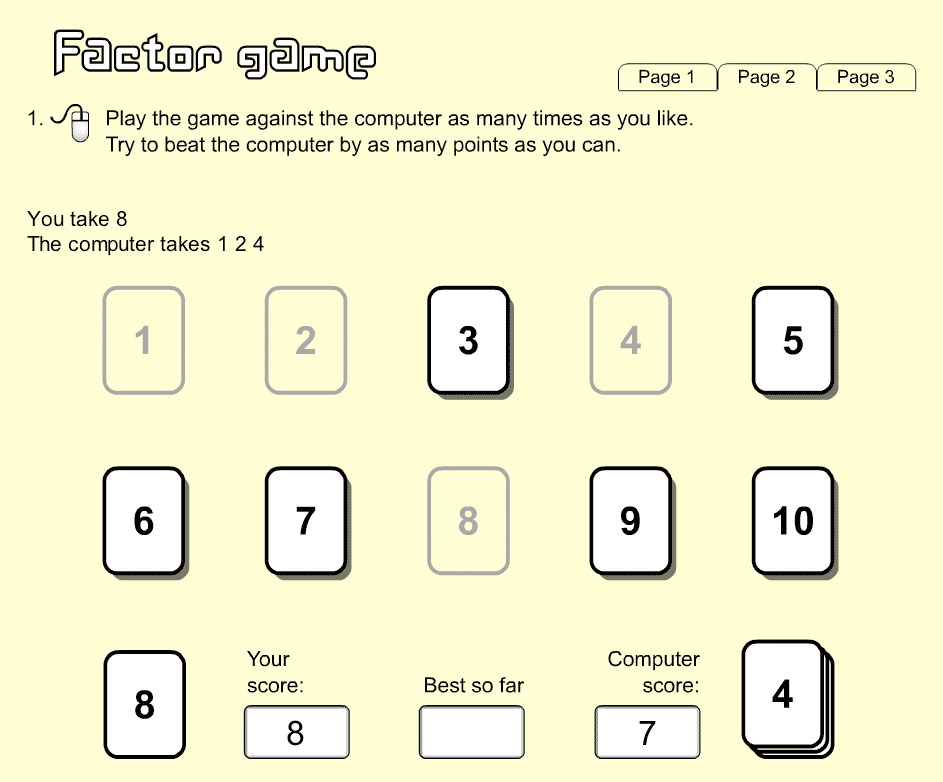
In Factor game (Figure
5) the computer played a key role in explaining the rules of the
game using an
animated sequence. The student's ability to formulate a strategy
was put to the test by challenging them to beat the computer by the
greatest margin possible. As a follow up, their understanding of
the strategy was probed by asking them to imagine a variant of the
game with 50 cards instead of 10 and to suggest the best opening
moves.
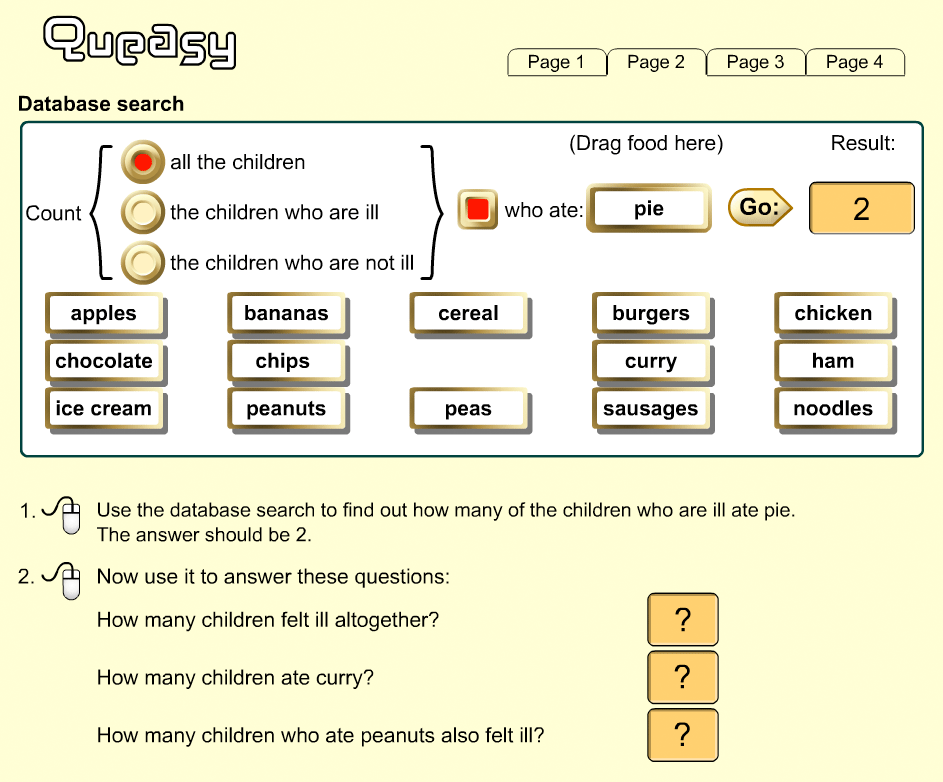
Exploring rich data sets
2
One advantage of computer-based tasks is that the student can be
offered a substantial database, rather than the dozen-or-so cases
feasible in a paper test. This allows assessment of the important
processes of choosing appropriate data, representing, summarising
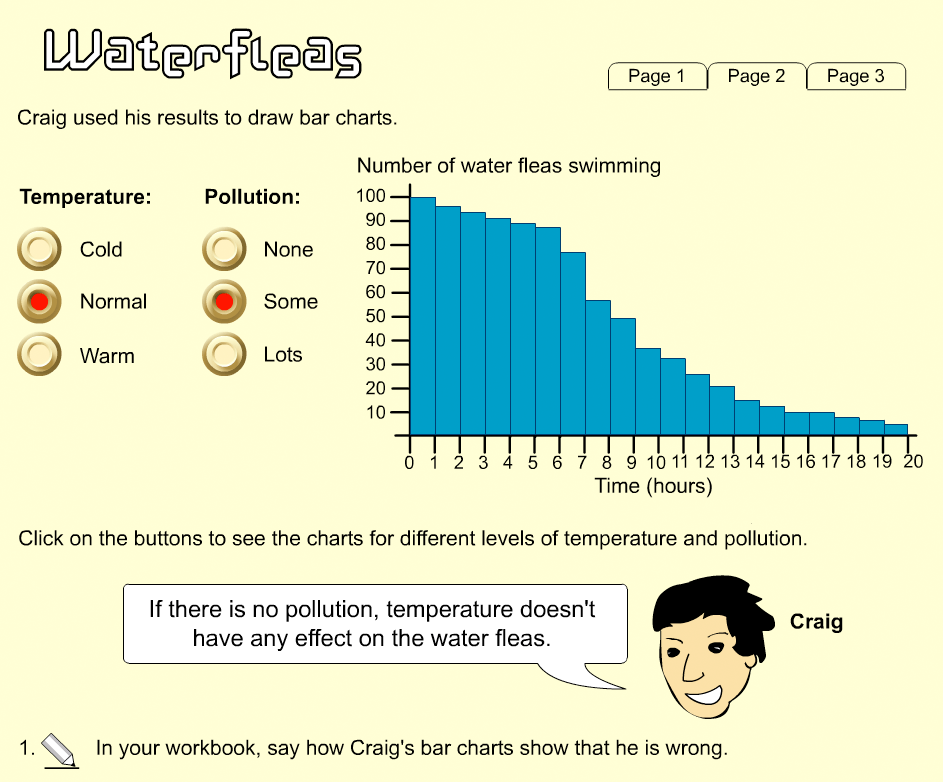
and interpreting it. Queasy (Figure 6) requires students to solve a
food-poisoning mystery by making suitable queries to a simulated
database while Water fleas (Figure 7) allows a large set of experimental
results with several variables to be viewed as bar charts and asks
whether these results support or refute a series of hypotheses.
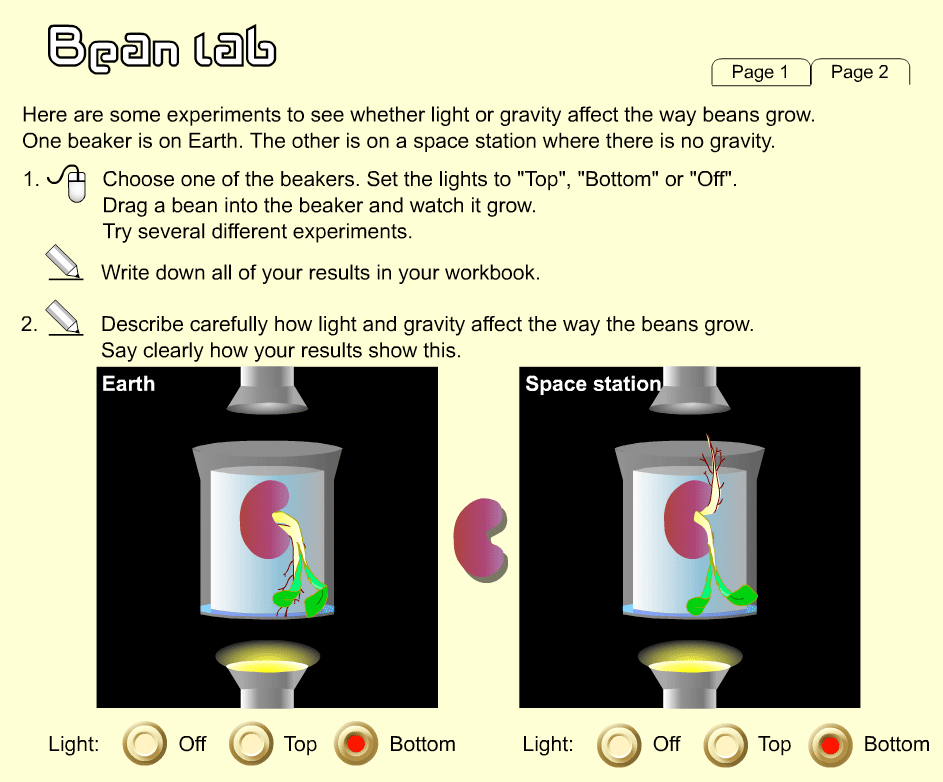
Use of the workbooks
3
As can be seen from the example screens, where questions required a
substantial written answer, students were directed to answer in the
paper workbook. While this could have been replaced by a type-in
text box, this would have placed a constraint on the type and
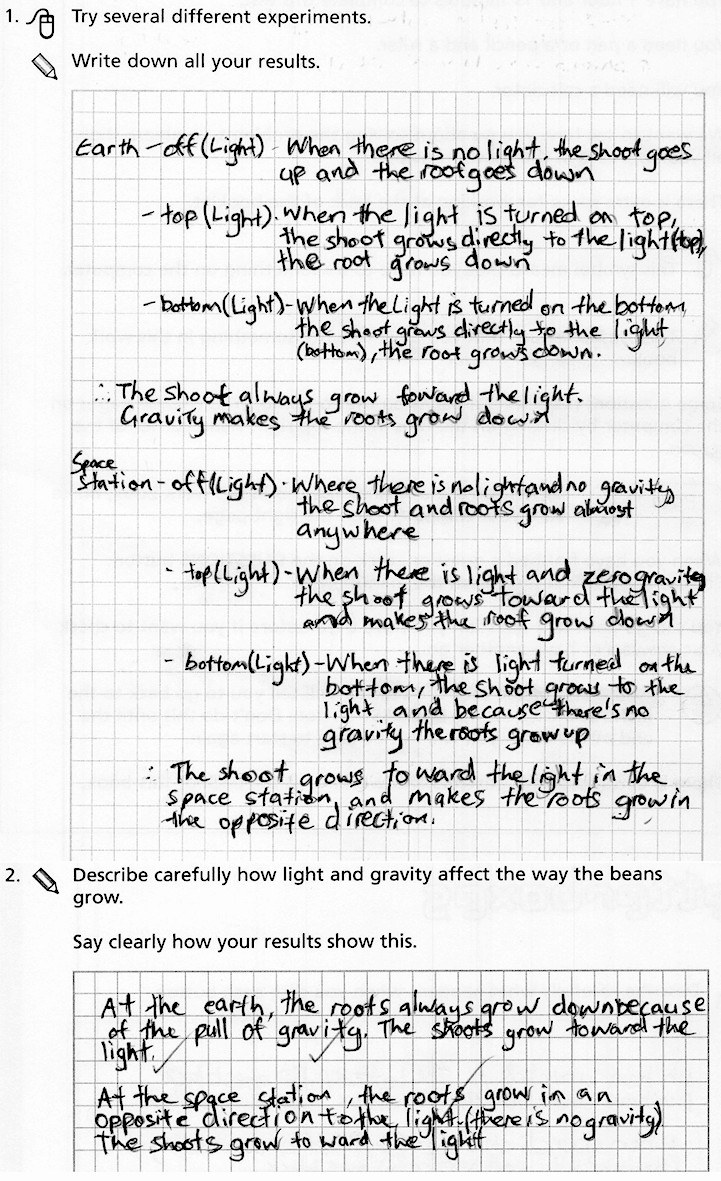
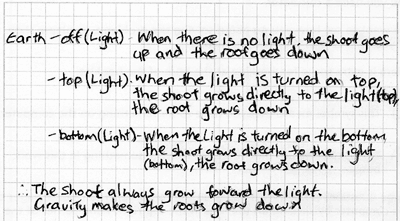
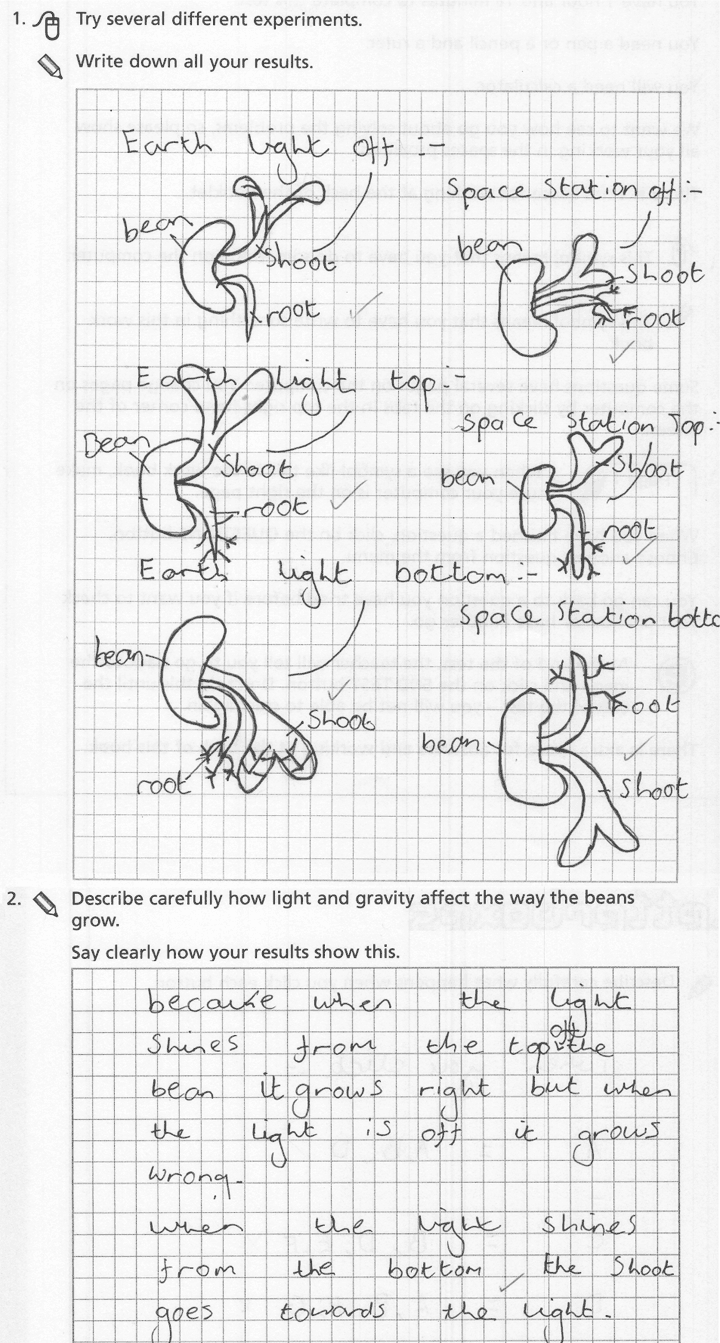
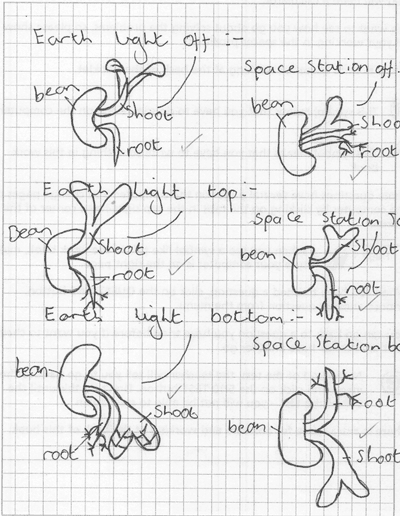
format of answers possible. For example, the task Bean Lab
(Figure 8) reproduced a
common classroom science experiment (with a zero-gravity twist not
so common in the classroom). The examples of student responses show
the diversity in their approaches to the first part of this
question.
Figure 9 is a purely
written answer, but the formatting provides valuable evidence of a
systematic approach. Producing this “hanging indent”
format in a basic, type-in-text field on a computer would have
been, at best, tedious and distracting. The test system would have
to provide word processing facilities and the students would need
to know how to use them.
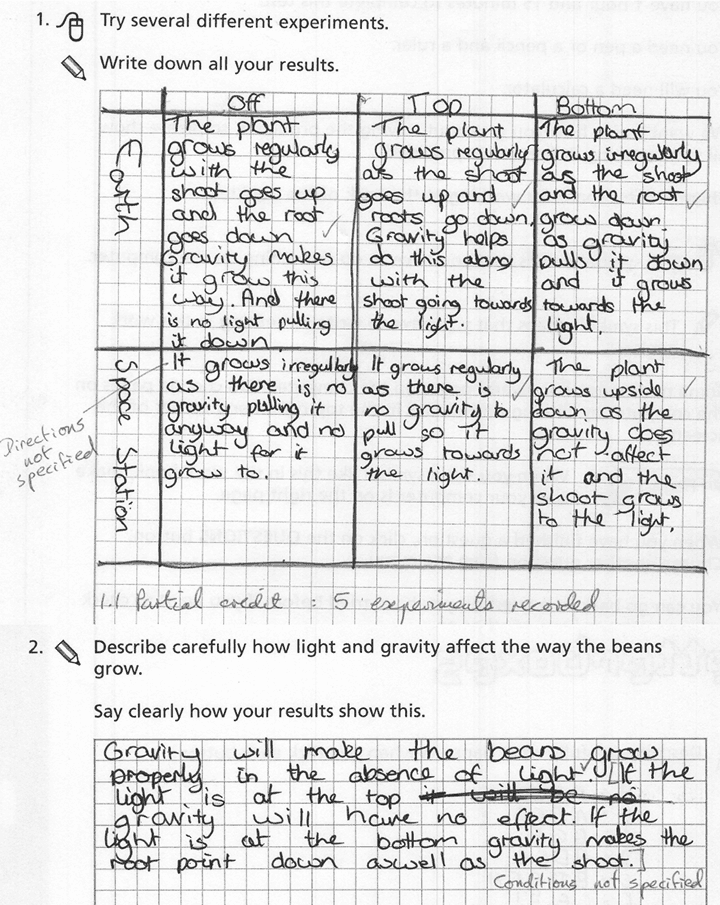
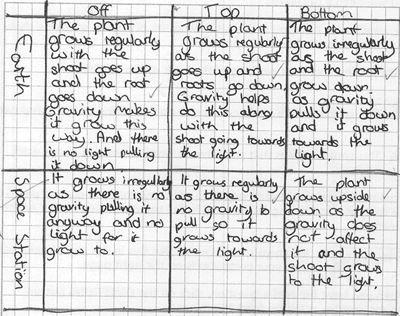
Figure 10 shows a
tabulated response, also providing clear evidence of systematic
work and good choice of representation. Again, this would have been
complicated for the candidate to replicate on computer, and
providing a pro-forma table to fill in would have distorted the
question by guiding the response. (The work books used
“squared paper” throughout to avoid giving any clue
that a table or diagram was expected for a particular question).
Figure 11 uses sketches
which would obviously have been difficult to capture on a computer.
It can be seen from these examples that each student went on
to produce a purely verbal answer to the second part of the
question, where they are asked to draw a hypothesis from the data.
This could have been typed in as plain text, so it might have been
possible to discard the answers for part 1 as “rough
work” and infer from part 2 whether systematic records had
been kept. However, there are two disadvantages with that approach.
Firstly, part 1 is an opportunity for less able students to gain
some credit for methodical work, even if they are unable to
articulate a hypothesis. Secondly, students might have taken
less care with this part of the task if they had known that it
would not be collected and marked (to properly investigate the
significance of this effect would be an interesting future study).
5. The development process
5
Initial design
The design philosophy was that design should start with valid and
engaging tasks that would allow candidates to show “what they
know, understand and can do” (Cockroft, 1982). Small-scale school trials of
the tasks took place at an early stage to ensure that students could
engage with the task and demonstrate progress. The scoring
schemes were developed continually throughout the trials to ensure
that they reflected the type and variety of valid responses produced
by real students, not simply the designer's anticipated solution, and
could be applied reliably by the scorers. The balancing instruments
described above were then used to assemble a test that adequately
sampled the assessment domain.
This approach differs from most test development, which is typically
centred on detailed, but abstract, specifications of the curriculum
areas to be covered, around which the tasks are constructed. This is
straightforward, but can lead to the sort of fragmentation and
contrived contexts often seen in assessments such as the General
Certificate of Secondary Education examinations in England (see
section 5.2 of Pead, 2010).
The above context-led technique would be impractical if applied
universally, so some tasks were inevitably written to address gaps in
coverage or balance as the test was assembled.
Ideas for computer-based tasks arose in various ways. They were
developed in brainstorming sessions; invented by individual designers
and other contributors; adapted from past projects or
“appropriated” from tasks under development for the paper
test. It was then up to the computer task designer to develop the
ideas into a workable specification.
At this point, one of the challenges of computer-based task
development became apparent: traditional paper-based tasks at this
stage of development would have been drafted, with clip-art graphics
and rough diagrams where needed, ready for further discussion and
refinement, initial approval by the clients and informal trials. For
computer-based tasks, though, all that was available were sketches of
the screen layout, the wording of the question and technical notes on
how any interaction or animation would work. Tasks in this state
could not be trialled in school. Even soliciting feedback from
colleagues and clients proved difficult when the task had significant
graphical, animated or interactive elements that any reviewer would
have to visualise based on the outline specifications.
Specification, commissioning and implementation
2
Programming of tasks was conducted by a third party, so the
next step was to specify each task in detail for the programmers.
The specification had to cover such aspects as:
- Details of the artwork required – this needed tight
specification due to the danger of introducing additional clues or
distractions: it is surprisingly easy to inadvertently include a
'red herring' in an image;
- Details and timings of any animation required;
- How on-screen objects should respond to various inputs,
covering:
- Suggested algorithms where objects have to move according
to mathematical rules, or where the computer must play or referee
a game;
- The range of possible inputs for type-in fields (e.g.
text, integers, decimals, including the number of decimal places).
Should the candidate be warned of/prevented from entering invalid
values?; and
- Rules for drag-and-drop elements – where on the
screen do objects start? How many are available? How they can be
removed? Should they automatically align to a grid?
- Details of what data should be captured and stored so that
it could be marked;
- Details of how the task should be paginated and whether some
elements should appear on all pages. This could be crucial, because
of the limited amount of information that can be presented on each
screen; and
- Eventually, specifications for the algorithms needed to
score responses automatically, although this stage came after the
initial implementation, once a manual scoring scheme had been
designed.
In the context of a 10-minute assessment task, where the candidate
must be able to rapidly grasp the concept without additional help,
the considerations above can be critical and are hard to separate
from the educational design. For example, the task designer might
design, on paper, a “cloze” question comprising a text
with missing words (or numbers) and a list of possible words to go in
the gaps. The student would copy the correct words into the gaps. A
programmer might decide to implement this by displaying the candidate
words on icons which the student could drag and drop onto the gaps in
the text. This is not necessarily the same problem, since
the new design means that you can only use each word once – a
constraint which is not present in the paper version. Even if the
correct answer only uses each word once, it is possible that a common
mistake involves re-use of a word, so denying the student that option
could affect the nature of the task.
From the point of view of a software designer aiming to produce
robust and easy to operate software, checking the validity of data
and dealing gracefully with any unexpected inputs is an important
consideration. Adding constraints and checks to the user interface
which restrict the domain of possible responses with which the
software must cope is therefore an attractive technique. This might make the
task simpler to score by preventing ambiguous inputs but could also
make the task easier by alerting the candidate when they entered a
wrong answer. The educational designer must be involved in deciding
how such constraints might alter the question. So, in the above
“cloze ” example, the designer must remember to
specify whether there should be more than one of each icon, something
which they might not consider in a paper-based task.
Typically, the first implementation of a task by the programmer had
serious faults and one or two rounds of improvement requests were
required to arrive at a version ready for trials. This was not simply
due to mistakes by the programmer, but often because the designer
wished to refine details having seen the first working version. Good
communication between the educational designers, graphics designers
and programmers was essential here, and the strictly partitioned
approach imposed by the World Class Tests project structure,
where (for instance) change requests sometimes had to be submitted in
writing without face-to-face contact with the programmer, was not
ideal.
As the project progressed, it was often found to be simpler for
the designer to produce partial working prototypes which implemented
the critical interactive aspects and included draft graphics and
animations, which could be fine-tuned before submission.
In the initial stages, the delivery “shell” which
allowed the candidate to log on and navigate through the questions
was also under development, as was a “library” of
standard buttons, input boxes and other controls. An example of the
sort of issue that arose here was whether it should be possible for a
candidate to return to a previous question to review, and possibly
modify, their responses. This is something that would be taken for
granted on paper, but which is only possible on computer if it has
been specifically provided for in the test delivery software.
Trial and refinement
3
Each task was scheduled to go through at least three rounds of
trials:
- “Informal”, closely observed trials with a small
number of students to ensure that they could engage with the task
and to identify any bugs or shortcomings in either the task content
or its technical implementation. These trials were often conducted
with students working in pairs, with no attempt made to present
balanced tests or gather psychometric data. Working in pairs
encouraged students to discuss their thinking (and, sometimes,
express their frustrations) without the observer having to interrupt
with questions.
- “Formal” trials, with around 50 students taking
each task, to establish that the tasks were performing well in an
assessment environment and producing an adequate spread of results.
These trials remained focussed on individual tasks. The resulting
student work was used to refine the scoring schemes and to inform
the assembly of the tasks into balanced tests.
- “Pre-test” trials of complete, balanced tests
– aiming for around 200 students per test – intended to
provide statistical data for calibrating the tests.
A major tension was that, for the first two rounds of trial to
be worthwhile, it had to be possible to rapidly revise and re-trial a
task. There was a conflict between the need to schedule school visits
for informal trials in advance and the requirement to commission any
revisions from the developers. A flaw in a task might become obvious
the first time a child tried to complete it, but whereas a paper task
could be redrafted overnight, it was often impossible to revise the
software in time for the next scheduled visit. Combined with the
delays in task commissioning noted above, and the problems with
getting infrastructure in place for trials (discussed below) this
meant that it was often impossible to put computer tasks through the
full, three-stage, iterative trial and refinement cycle, and many
tasks skipped the “formal trials” step.
Some design challenges
4
Finding the task in the context
The desire for rich and interesting contexts has to be balanced
with the constraints of the assessment. Many appealing subjects
emerged from brainstorming sessions – such as Muybridge's
famous pictures of galloping horses, or analysis and comparison of
demographic data from many countries – but identifying a
self-contained, 5-15 minute task set in that context often proved
difficult.
One of the hardest decisions for a lead designer was when (and
how) to diplomatically reject a contributed idea, into which a lot of
research and effort had already been put and which would make a
wonderful extended investigation, on the grounds that no
well-defined, score-able task had been identified.
Eliminating trial and error
When designing interactive test items based around a microworld
or simulation, a key challenge is finding questions which genuinely
probe the students' understanding of the situation and which cannot
be answered with a simplistic “trial and improvement”
approach in which the student uses the simulation to check possible
answers.
Tactics used to eliminate or reduce trial and improvement
include:
- Written explanation – ask students to
describe their strategy/justify their findings, or to support/refute
some suggested hypotheses.
- Simple challenge – ask students to
“beat the computer” and rely on the time constraints of
the test to discourage brute force/trial and error solutions.
- Logging and analysis – record every
interaction between the student and computer and then try to analyse
this data to spot promising patterns and sequences. This requires
complex coding and could be fragile: a few random interactions not
indicative of the students' thought processes could disguise a valid
response. Generally, a large corpus of trial data would be needed to
validate such an approach.
- Heuristic inference – Table 1 shows a
possible scheme for scoring the Sunflower task (Figure 3) which infers the
sophistication of reasoning and strategy shown by the student based
solely on their best result, without recourse to their written work
or their sequence of trials. Likewise, with Factor Game (Figure 5) the final score was
taken to be indicative of the level of understanding: most students
could beat the computer eventually; a “high score” of 30
suggested that the student grasped the idea of factors and
multiples; 35 implied they had made some progress towards a strategy
for improving their score while the optimum score of 40 was unlikely
to be achieved without a well-developed strategy. This has the
advantage of being easy to program and fairly easy to justify
– but the approach does not lend itself to all tasks.
- Extension problems – after exploring
an interactive scenario, such as a computer game, the student is
asked to demonstrate their understanding by making inferences or
predictions about an extended or generalised variant, with no
simulation available. This technique was also used in Factor
Game, where the final challenge is to suggest the optimum opening
moves in a game with 50 cards instead of 10. In other
cases, an arbitrary limit was set on the range of inputs accepted by
the simulation and the final question lay outside that domain.
6. Technical and Logistical Challenges
6
Technical issues
The project started before widespread access to broadband
internet connections could be taken for granted. Consequently, most
of the tests were delivered on CD and had to be installed on
individual computers. The data then had to be extracted from the
individual computers and returned by email or mailed on floppy disc.
This proved to be a major challenge – especially in
schools with networked systems that prevented individual machines
from writing to their local hard drives. Although this potentially
meant that administration and data collection could be centralised,
the diversity of networking systems and lack of technical support
made installation complicated. Even on stand-alone systems there was
a high incidence of lost data when teachers were asked to manually
copy and return data. The agency performing the programming and
delivery software design was also somewhat naïve about the level
of technical proficiency that could be expected from teachers (such
as their ability to copy files by dragging and dropping rather than
opening them in a word processor and re-saving).
Whatever the problems with internet delivery of assessment, the
possibility of “zero-install” delivery and automatic return of data is
attractive in the light of the experiences with World Class
Tests.
Project management issues
2
The early years of the project were somewhat fraught, and there
may be some lessons to be learned for future projects. Some of the
issues included:
- Structure of the project – the
organisation, as conceived, was heavily compartmentalised –
with two groups contracted to work on the educational design, a
third contractor handling the software development and a fourth
(appointed later) responsible for “delivering” the
tests. This seemed to be founded in a publishing metaphor:
manuscript -> editor/designer -> publisher/distributor; which
assumed that the hand-over between each stage was routine and well
understood. Initially, this led to designers being unaware of the
constraints of the delivery system and programmers not understanding
the aspirations of the designers.
- Task specification and approval – as
discussed above, when tasks involve substantial interactive
elements, programmers must be supplied with more than the question
text and a sketch of the artwork. The workload of specifying the
tasks, testing implementations and specifying revisions had been
underestimated, and largely fell on one or two people. This delayed
the commissioning of new tasks from the programmers – who were
expecting a steady flow of routine work.
- Prototyping – in a non-routine
project such as this, it is hugely ambitious to expect to go
directly from paper specification to final implementation. Quickly
prototyping partly-working examples, so ideas could be rapidly refined
– or possibly rejected – was found to be more efficient. The prototypes proved an effective way to communicate the
design to the final programmers.
- Technical oversight –the project had
several stages of internal and external review to ensure the
educational validity of the materials. There was, initially, no
corresponding oversight of the technical issues or agreement between
the designers and programmers as to what the constraints or
expectations of the system were. An internal committee was
eventually set up, but its source of authority was unclear.
- Timing – although the overall
timescale – two years until the first live sittings - was
appropriate, the contract mandated a large scale trial just a few
months after the effective start of the project. This would not have
been unreasonable for paper based tests which could easily be
piloted in draft form. In contrast, but delivery of computer tasks required
substantial infrastructure development as well as programming of the
actual tasks, and the attempt to meet this requirement largely
failed. Multiple rounds of trial, feedback, revision and calibration
are critical to developing a robust and valid test but, in a
computer-based project, need to be reconciled with the fact that a
substantial amount of programming needs to be completed before any
materials can be trialled.
- Short-term contracts & rights –
this affected the programming side in particular – with no
ongoing commitment to continue the contract after the initial two
years and all intellectual property rights assigned to the client,
there was little commercial incentive to invest time in building a
solid technological infrastructure which might then have been taken
over by the lowest tenderer at the end of the contract.
7. Outcome of the project
7
The project produced a bank of 5 complete tests at each of ages
9 and 13, which have been successfully administered, marked,
moderated and graded on a commercial scale, setting it apart from
“blue sky” eAssessment projects that develop and deeply
research a handful of ambitious exemplar tasks.
Students in the target ability range were able to make progress
on the tasks, producing a good spread of scores which adequately
discriminated between different levels of performance.
Development of new test items was stopped in 2003, but test sittings
continue with the existing materials – see www.worldclassarena.org.
On that site it says: “Since the first test session in 2001,
over 18,000 students in over 25 different countries worldwide such as
Australia, Hong Kong, New Zealand, Saudi Arabia, Slovenia, the United
Arab Emirates, the United Kingdom and the United States have taken
the tests.”
In the later stages of the project, it was realised that
students who had never encountered these types of problem in the
classroom found the tests particularly difficult. Consequently, some
of the test development effort was diverted to produce teaching
materials based around adapted and extended versions of previous test
questions. The approach used was that students would tackle the task
individually or in pairs, and then engage in a classroom discussion
in which they compared their techniques with other groups, and
against specimen solutions provided with the materials. The tasks
chosen were, intentionally, challenging so many students would only
make progress after sharing techniques.
The classroom materials were published by nferNelson, including 6
modules under the title Developing Problem Solving (Crust, Swan, Pead et al. 2005).
More details of the design philosophy of these tests can be found in
Computer-based assessment: a platform for better tests? (Burkhardt & Pead, 2003
).
8. Conclusions
8
The World Class Tests project illustrates several ways in
which the computer can deliver rich, open tasks involving simulated
experiments, “microworlds” puzzles and games,
significantly expanding the domain of task types and contexts which
can be included in a formal, external assessment.
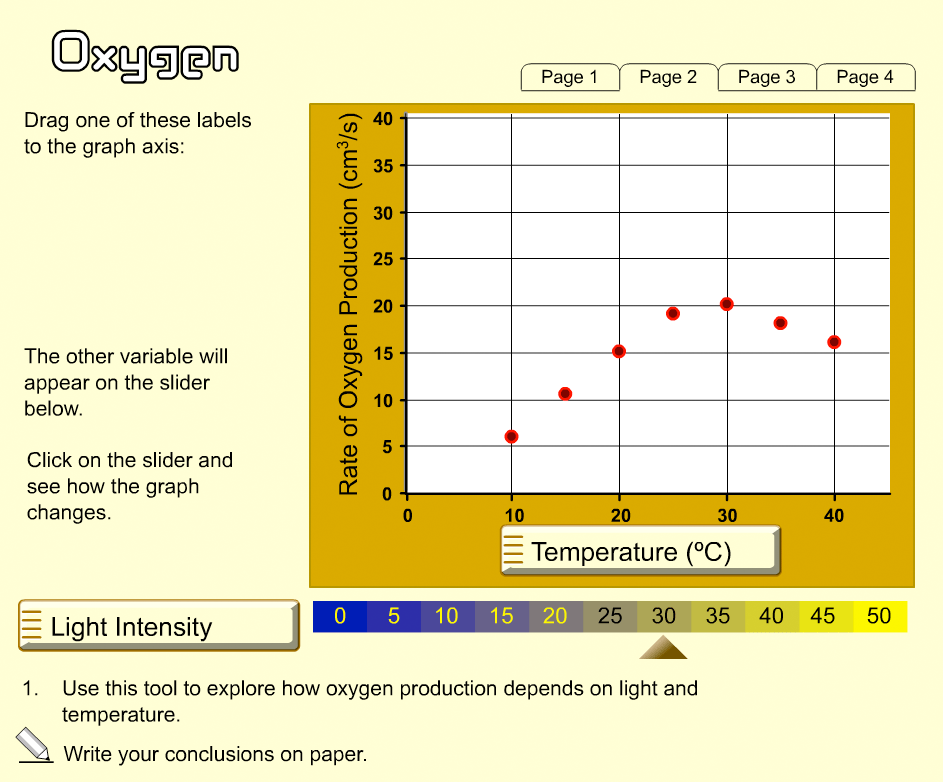
The project also showed that students could successfully
investigate and explore relatively complex relationships when they
were presented clearly and interactively on the computer – in
one study (Ridgway, Nicholson, & McCusker, 2006) based on the materials,
computer-based tasks involving
multivariate data, such as Water Fleas (Figure 7) and Oxygen
(Figure 12), were found to be scarcely more difficult than
paper-based tasks based on single-variable data sets. The implication of
this is that students could realistically be assessed using more
complex, realistic and relevant problems on modelling and
statistical literacy than is possible by conventional means. This
is one way in which online assessment could improve the range and
balance of the assessed curriculum..
The main success of World Class Tests was in using the
computer to deliver microworld-based tasks in a mixed computer and
paper assessment. However, half of the assessment in World
Class Tests was still in the form of paper-and-pencil tests, in
addition to which the problem-solving computer tests relied partly on
a paper answer booklet. While the challenges in producing a
completely paperless test may have been soluble on a task-by-task
basis, the design and programming load of scaling this to adequately
sample the subject domain and deliver 2-4 test sittings a year would
have been considerable.
The greatest implication for the technical and pedagogical
processes of computer-based assessment design is the clear need for
two, usually separate, areas of expertise to work together to ensure
that the technical aspects of the product reflect the pedagogical
principles on which it was based. Task designers accustomed to
handing over their paper manuscripts for conventional typesetting and
printing need to become involved in key decisions over animation,
interactivity and response input methods, while programmers need to
learn how their decisions can impact on pedagogical issues and know
when to refer a technically-driven change back to the designer. If
programmers are to work from detailed specifications then it must be
recognised that developing these specifications is a new and
significant phase of development not present in a traditional
paper-based product cycle.
There are also challenges for design research models which rely
on multiple, rapid cycles of trial and refinement. This is
straightforward when the “refinement” step means a few
changes to a paper document; less so when it entails specification,
commissioning and testing of software changes.
Acknowledgements
ii
Although the author was the lead designer and editor for the
computer-based problem solving portion of the World Class
Tests, the tasks were a team effort and include the work of Richard
Philips, Malcolm Swan, Rita Crust, Jim Ridgway, Sean McCusker, Craig
Turner and others. The Flash implementations shown here were produced
by Vivid Interactive and Doublestruck Ltd. The World Class
Tests are available from World Class Arena Ltd. (http://www.worldclassarena.org/).
Footnotes
iii
References
iv
Phillips, R. et al. (1985). Teaching With A Micro: Maths 2.
Nottingham, UK. Shell Centre for Mathematical Education.


