30 Design Strategies and Tactics from 40 Years of Investigation
Appendix: Further information and examples
Investigative app-based microworlds
ITMA and beyond
Even a very simple computer application can be used as the basis for a rich mathematical investigation. The Investigations in Teaching with Microcomputers as an Aid project was a 1980s collaboration between the College of St Mark and St John in Plymouth, the Shell Centre in Nottingham and Longmans publishers. In the early 1980s when the majority of UK schools were getting computer equipment for the first time, a typical school would only have a few computers, so the norm would be one computer, mostly operated by the teacher, at the front of the class, with a large TV screen. The ITMA project, therefore, set out to use the computer as a 'teaching assistant' providing visualizations and simulations (“microworlds”) with extensive supporting lesson plans and worksheets.
Some of the applications were very simple – one was a variation on the classic ‘function machine’ activity, albeit with well-developed lesson plans – another simply displayed a sequence of ‘traditional’ calculations and paused before showing the answer (with the optional twist that the computer sometimes made deliberate mistakes). It proved surprisingly compelling for students trying to beat the computer. Some of the more sophisticated applications are illustrated below:

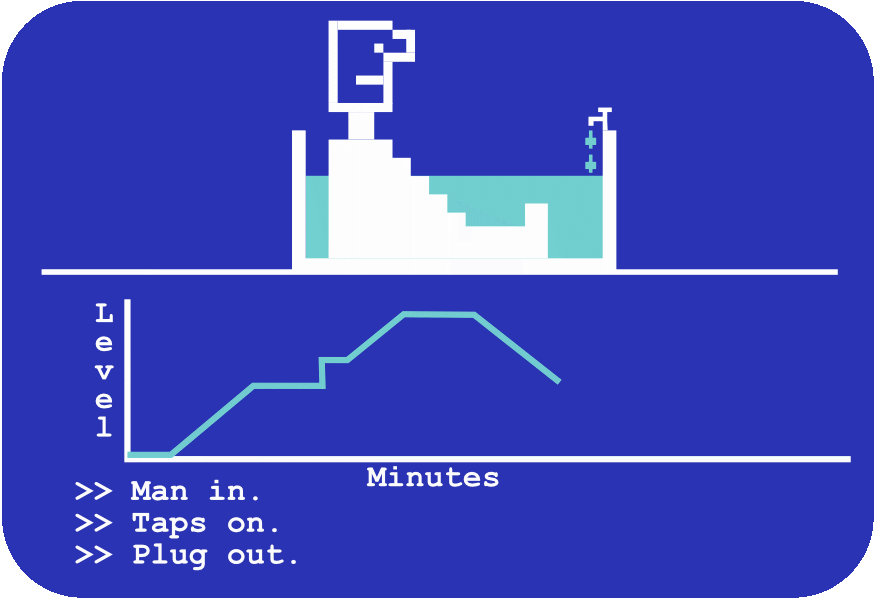


- Eureka
- graph interpretation for younger students, telling the story of taking a bath based on a water level vs. time graph. The challenge comes when only the graph is shown: what is the story?
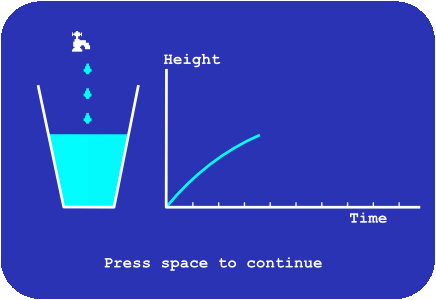
- Bottles
- more advanced graph interpretation with a pre-calculus flavor.
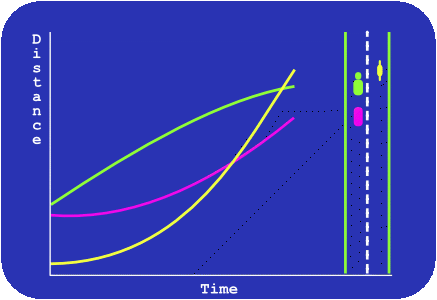
- Traffic
- introducing distance-time graphs by relating then to snapshots of vehicles moving down a road.
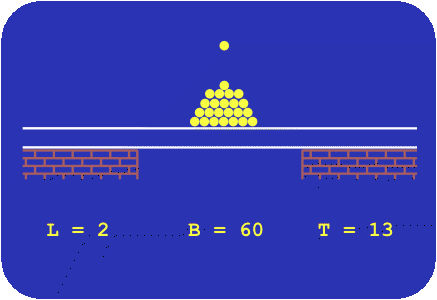
- Bridges
- simulation of the classic strength of a bridge vs. length, breadth and thickness experiment.
Enlarge…

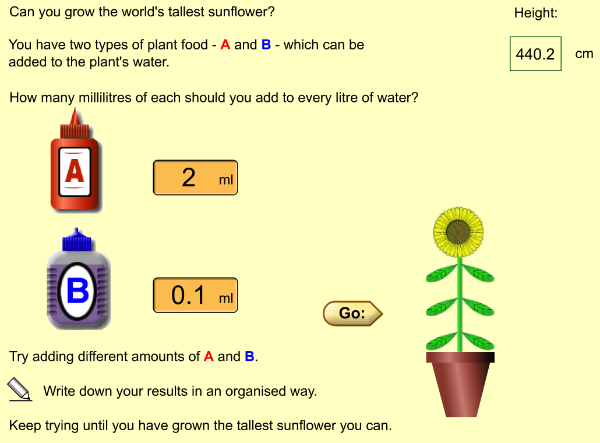
- Sunflower
- Develop a systematic search strategy for finding the combination of nutrients that grows the tallest sunflower. This is a cut-down implementation of the ITMA original, produced as a summative assessment for the much later World Class Tests project.
The work on ITMA found that these applications fostered a natural role shift in the classroom, with students proposing the next thing to try with the software while the teacher simply acted as a facilitator. (See Role Shifting under Design Tactics).
World Class Tests/Arena
Link to article
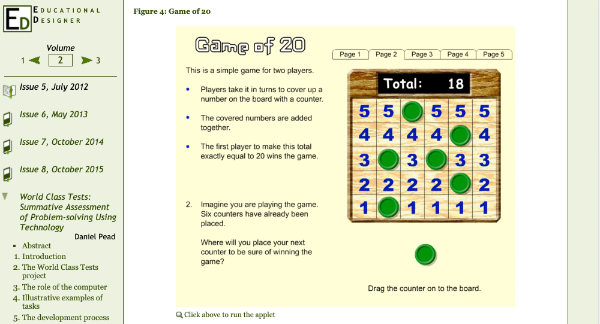
The ~2000 World Class Tests in “Problem solving in mathematics, science and technology” made extensive use of small, interactive applets to present rich problem solving activities in a summative assessment environment, often building on ideas from ITMA. The project is discussed in Pead (2012).
Links to materials:
- Educational Designer article on WCT
- https://www.educationaldesigner.org/ed/volume2/issue5/article18/
Bowland Maths
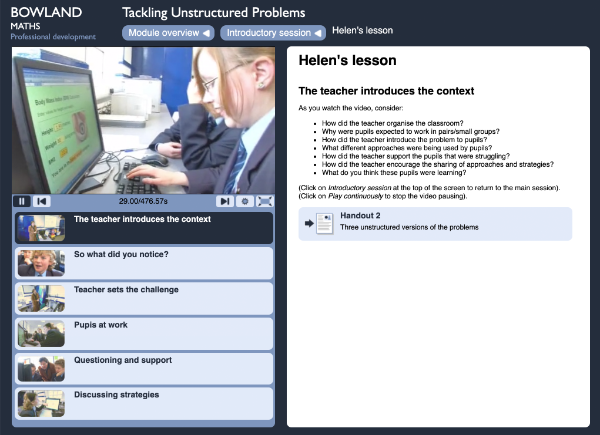
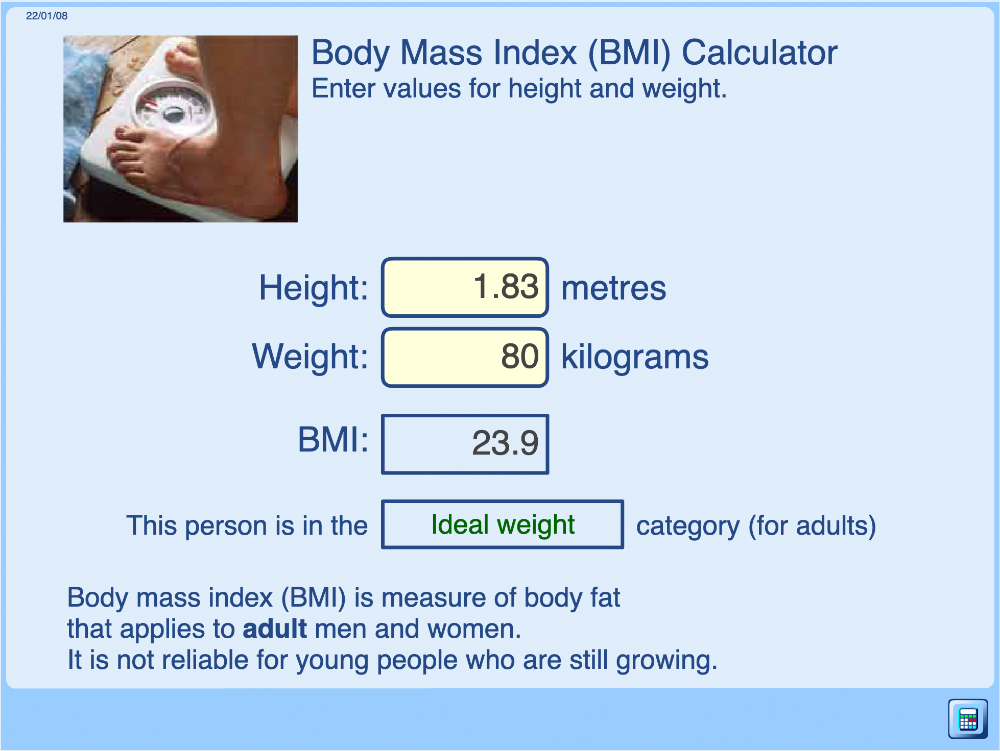
Many of the Bowland Maths case studies (see elsewhere) were built around small software “microworlds”. Additionally, several of the PD modules featured shorter, microworld-based exemplar lessons. Extensive video of a lesson using a very simple applet to calculate Body Mass Index (BMI) can be found in the “Tackling Unstructured Problems” PD module.
Link to Bowland Maths website
Enlarge…
Links to materials:
- Bowland Maths BMI Lesson
- https://www.bowlandmaths.org.uk/materials/pd/online/pd_01/pd_01_intro_class_5.html
Freudenthal Institute
Enlarge…
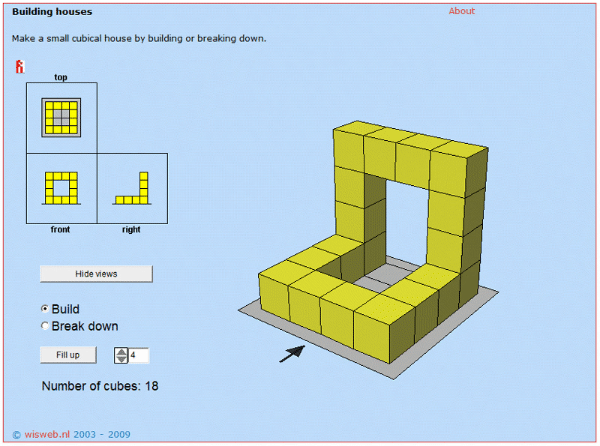
Mention should be given to the large range of microworlds produced by the Freudenthal Institute – the design of some of these is discussed in Peter Boon’s Educational Designer article (Boon, 2009). Unfortunately the examples in that article are difficult to run in modern browsers, but free demonstrations of some of the modern versions are available at: https://www.dwo.nl/site/index_en.html
Interactive Geometry and Graphs
There are many well-known examples of interactive geometry software dating back to the 1980s, such as:
- The Geometric Supposer (see e.g. Schwartz & Yerushalmy 1987)
- The Geometer’s Sketchpad (https://www.keycurriculum.com/)
- Cabri Geometry (https://cabri.com/en/)
- Geogebra https://www.geogebra.org/
…and too many graph plotters and graphing calculators to list (some of the above Interactive Geometry packages include function and data graph plotting) – one free, online example being Desmos (https://www.desmos.com/).
Link to materials
These have several modes of use. Students can, after learning the basics of the software, use them directly, as massively open-ended investigative tools too broad to be categorized as “microworlds”. Teachers can use them as vivid, but fairly closed, visualization tools to illustrate a concept (such as the shape of a quadratic function or the relation between a point moving on a circle and a sine wave). Or, teachers or materials designers with more time to learn the software can produce quite ‘polished’ interactive applets that can form the basis of student investigations.
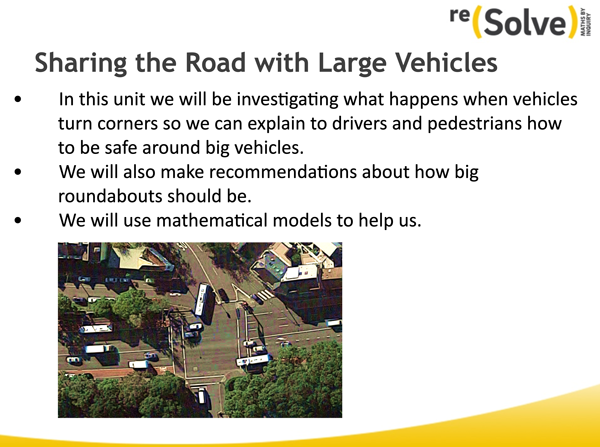
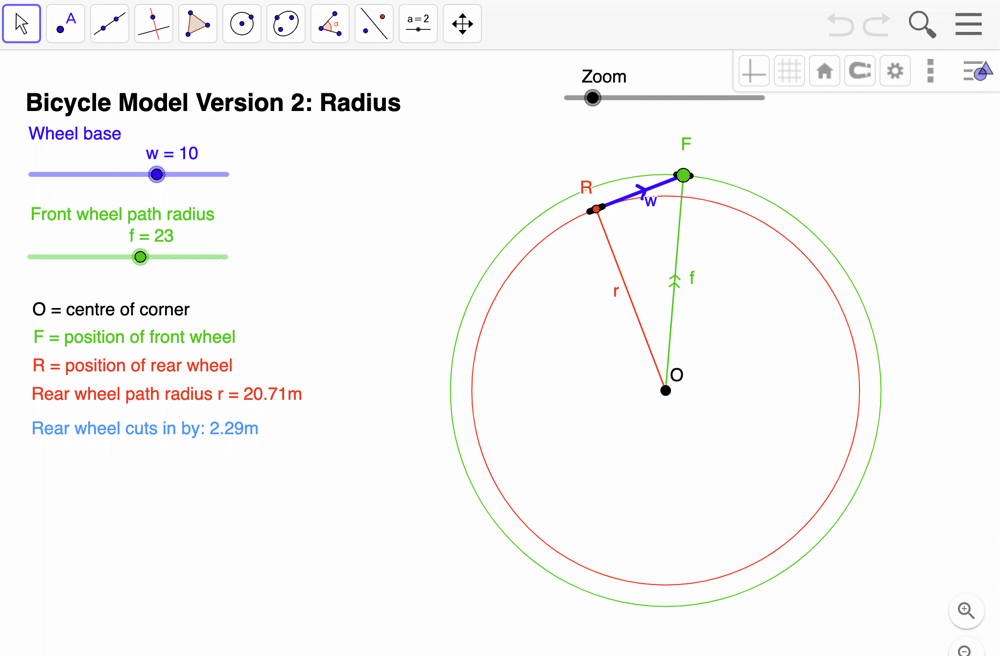
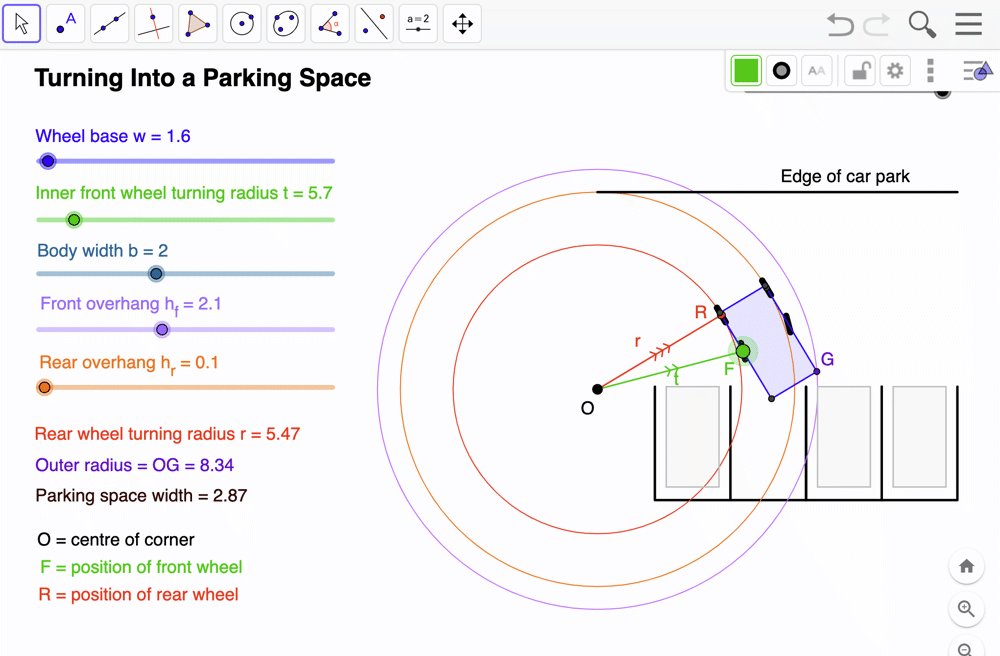
For example, one of the modules designed at the Shell Centre for the Australian Academy of Sciences’ reSolve project (https://www.resolve.edu.au/) is a modelling activity about how long vehicles turn corners. This is accompanied by a set of Geogebra resources illustrating various models of the scenario – the geometric constructions are pre-set but the vehicle can be moved around its path and key lengths can be adjusted using sliders, allowing students to explore the properties of the model.
Watch the video
reSolve materials courtesy Australian Government Department of Education reproduced under Creative Commons Attribution 4.0 International (CC BY) licence.
Geometry or graphing packages can allow teachers and materials designers to create such microworlds with less effort and technical knowledge than writing software applets ‘from scratch’. The websites for most of the geometry packages listed above have copious examples of demonstrations and microworlds.
Pre-prepared spreadsheets can also be used for investigating mathematical models and data.
References:
Schwartz, J.L. & Yerushalmy, M. (1987). The Geometric Supposer: An Intellectual Prosthesis for Making Conjectures. College Mathematics Journal, 18(1), 58-65. Retrieved March 3, 2020 from https://www.learntechlib.org/p/137764/.
Pead, D. (2012)
World Class Tests: Summative Assessment of Problem-solving Using Technology. Educational Designer, 2(5).
Retrieved from: http://www.educationaldesigner.org/ed/volume2/issue5/article18/
Boon, P. (2009)
A Designer Speaks. Educational Designer, 1(2).
Retrieved from: http://www.educationaldesigner.org/ed/volume1/issue2/article7/