30 Design Strategies and Tactics from 40 Years of Investigation
Appendix: Further information and examples
Devise vivid representations
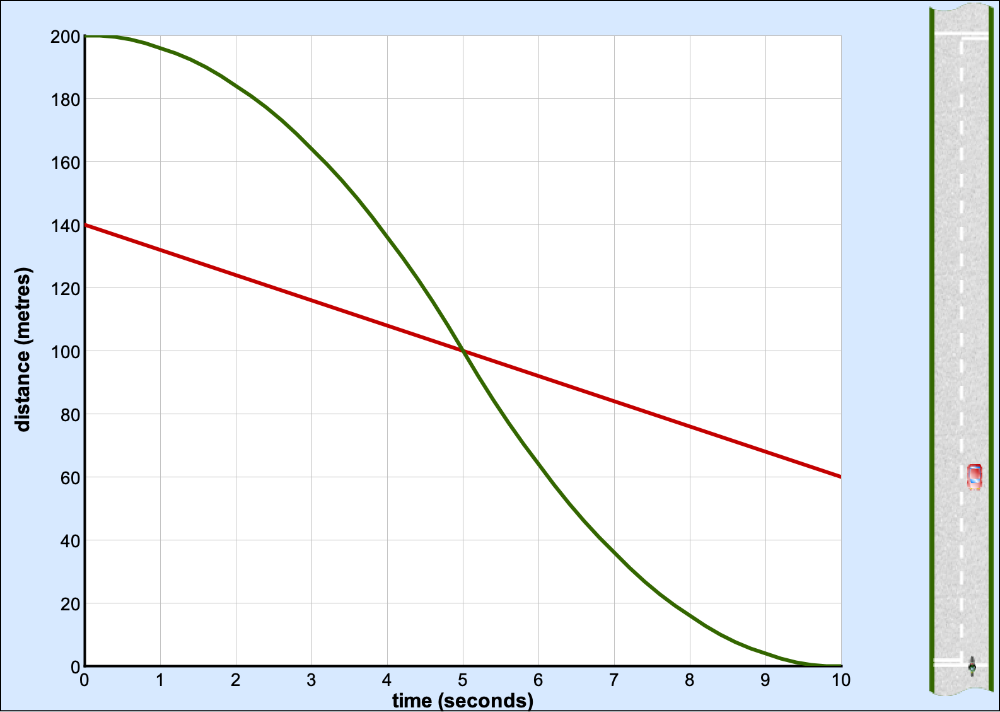
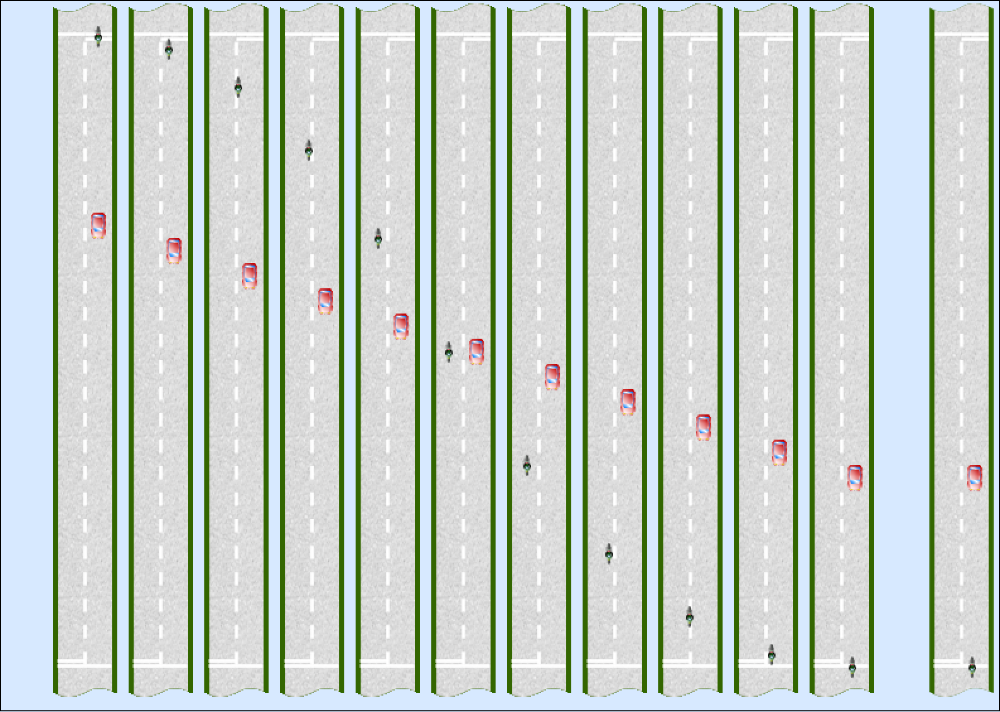
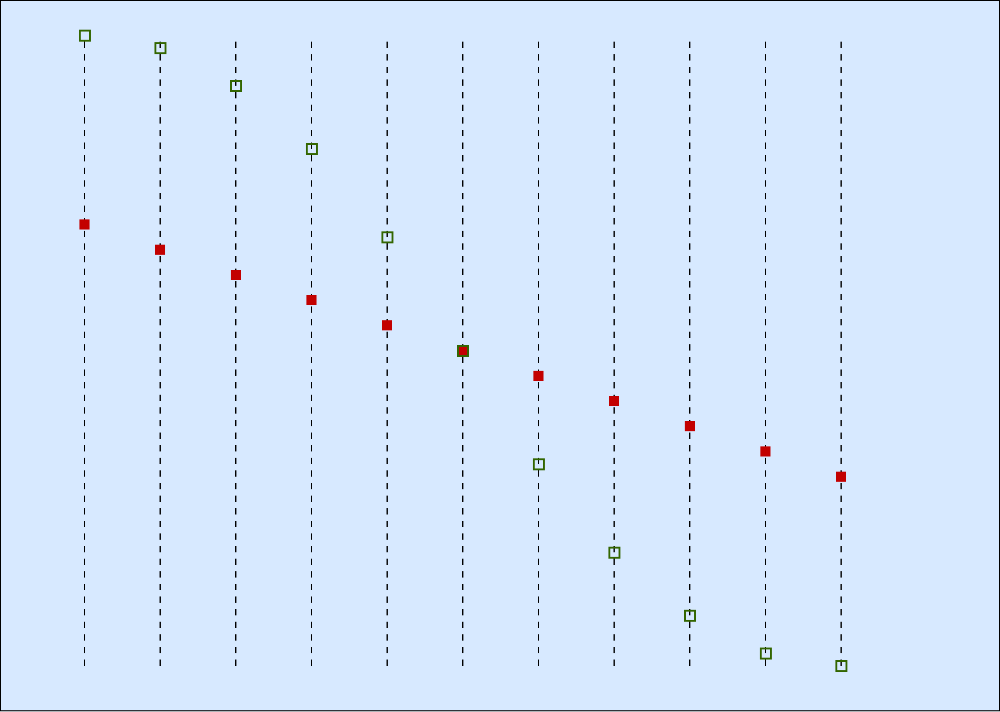
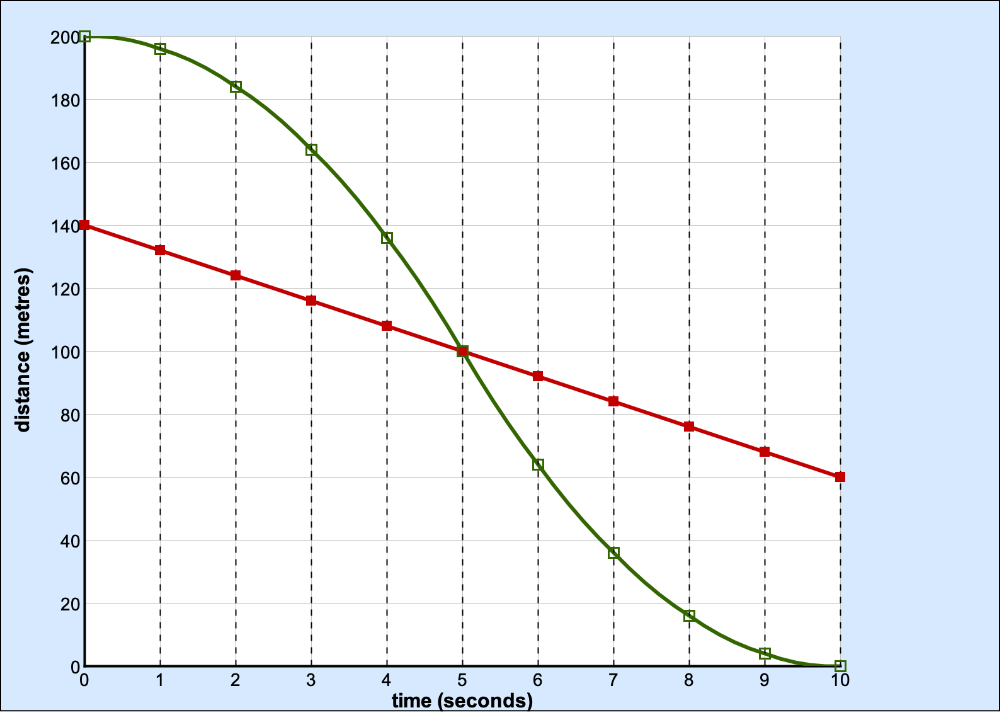
Pictures, diagrams, animations and video can all help make mathematical tasks and concepts more comprehensible. Multiple representations of a concept are particularly valuable in building connections between mathematical concepts. The early work on Investigations on Teaching with Microcomputers as an Aid made extensive use of the potential offered by even the limited graphics capability of 1980s microcomputers. Traffic, for example, showed the transition from an animation of vehicles moving along a road, through a series of snapshots to a continuous distance-time graph. The applet shown below is a more recent version from Improving Learning in Mathematics (Swan 2005).
Watch the video
Enlarge…
Current technology, with ‘interactive whiteboards’ now widespread in schools, allows far more sophisticated graphical demonstrations and video to be used in the classroom – including graphing tools and interactive geometry for more abstract topics and videos of ‘real’ situations showing applications – with sufficient production resources, the two can be combined. See Design lessons as dramas and Investigative app-based microworlds for more examples.
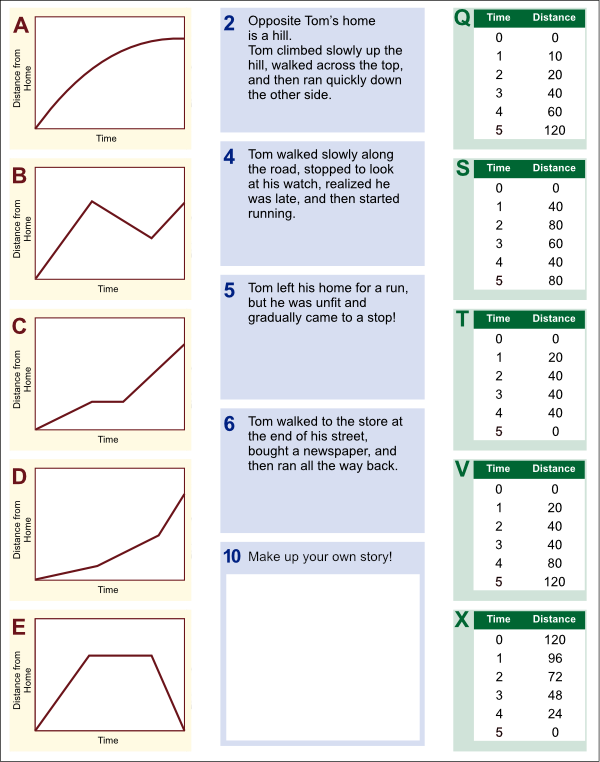
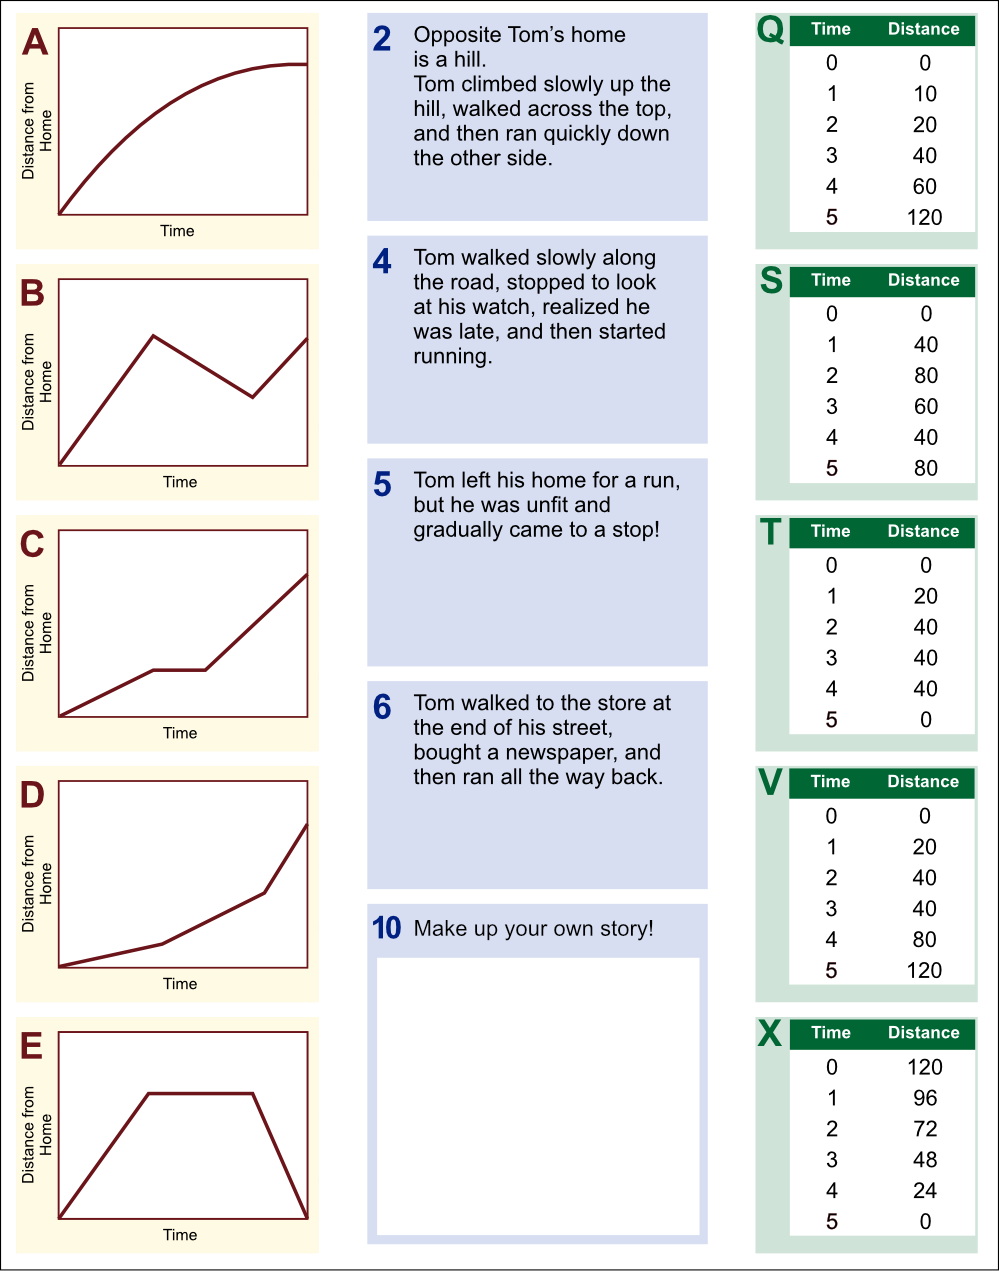
Vivid representations are not limited to technology – with good illustrations being invaluable in paper-based materials. Paper representations can even be made ‘interactive’: Improving Learning in Mathematics (Swan 2005), and, later, Mathematics Assessment Project’s Formative Assessment Lessons (map.mathshell.org) implement the ‘multiple representations’ approach as sets of cut-out cards showing (for instance) graphs, verbal descriptions and data tables. The task is to match the cards describing the same thing – and justify the matches. This not only allows the students to think about multiple representations, but it also makes the students’ thinking and possible misconceptions highly visible to the teacher as they walk around the classroom.
More examples, and a discussion of the design process behind these activities can be found in Swan (2008).
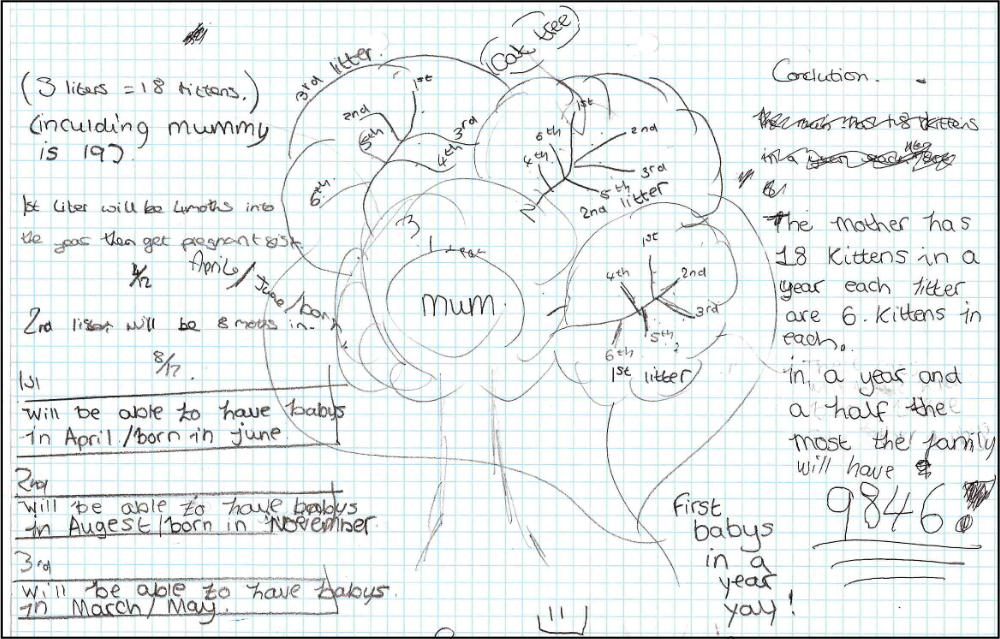
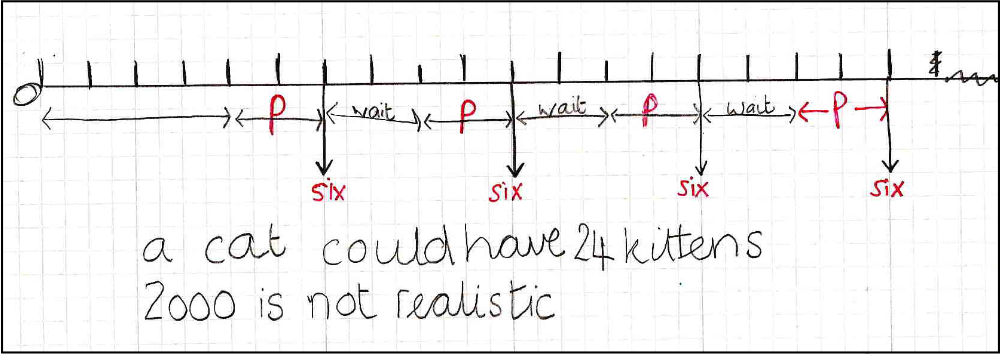
Activities can also require students to choose and create representations to help them solve problems, or to communicate their solution. In the task Cats and Kittens (developed for Bowland Maths by Acumina Ltd.) students are asked if the statement ‘In just 18 months, this female cat can have 2000 descendants’ is plausible, and given some background information. They need to devise some sort of representation to illustrate their reasoning.
Link to lesson video
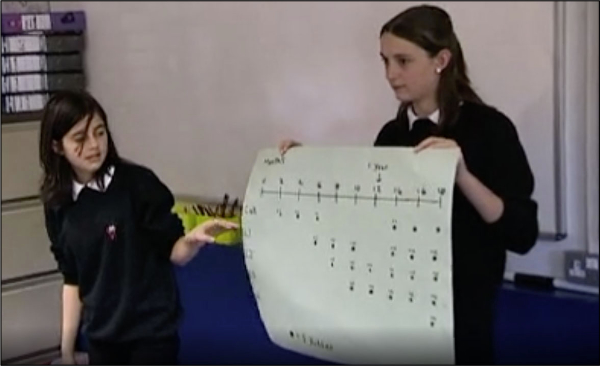
Many activities developed by the Shell Centre – including the MAP Formative Assessment Lessons – ask groups of students to produce a poster illustrating and explaining their solution. Presenting and explaining their work helps reinforce students’ understanding, as well as helping the teacher assess the result. A video of this lesson can be browsed on the Bowland Maths PD website
Links to materials:
- MAP – Distance-Time Graphs
- https://www.map.mathshell.org/lessons.php?unit=8225&collection=8
- Bowland Maths – Cats and Kittens
- - https://www.bowlandmaths.org.uk/assessment/cats_and_kittens.html
- Cats and Kittens lesson video
- https://www.bowlandmaths.org.uk/materials/pd/online/pd_06/pd_06_intro_04_dominic.html
References
Swan, M. et al. (2005). Improving Learning in Mathematics: Challenges and Strategies. Sheffield: Teaching and Learning Division, Department for Education and Skills Standards Unit. Available online at: https://www.stem.org.uk/elibrary/collection/2933
Swan, M. (2008) A Designer Speaks. Educational Designer, 1(1). Retrieved from: http://www.educationaldesigner.org/ed/volume1/issue1/article3/