Multidimensional Science Assessment: Design Challenges and Technology Affordances
Abstract
Contemporary views on what students should learn increasingly emphasize that students need to acquire more than a base of knowledge; they need to acquire the skills and abilities to use such knowledge in dynamic and flexible ways. To be most effective, learning environments need assessments that are aligned to these perspectives. Using a principled design framework can help guide assessment development toward such targets. Even when using a framework, however, thorny design challenges may arise. Technology-enhanced assessments offer opportunities to overcome such challenges but are not a solution in and of themselves and can also introduce new challenges. In this paper, we describe three challenges (conflict between multiple dimensions of science proficiency, authentic data, and grade-appropriate graphing tools) that we faced when designing for a specific Next Generation Science Standard, and the theoretical and design principles that guided us as we ideated design solutions. Through these designs we maintained alignment to our multidimensional assessment targets, a critical component of our larger assessment validity argument.
Introduction
Multiple contemporary educational systems aim to promote deeper learning and foster students’ 21st century skills and capabilities (Pellegrino & Hilton, 2012). For students to succeed in tomorrow’s world they will need to engage in deeper learning, i.e., learning that allows them to take what they learned and apply it flexibly and productively to new situations. Flexibility is critical to realizing this transfer, and engendering such flexibility requires students to develop a durable and interconnected conceptual knowledge base (National Research Council [NRC], 2000). Students must also be able to use disciplinary tools and practices in a way that suits the particulars of a problem while being guided by their interconnected conceptual knowledge base.
Achieving any substantial learning goal in a formal learning environment requires that curriculum, instruction, and assessment are aligned and working towards the same purpose. In this paper we focus on the design of science assessments that are appropriate for these contemporary views of science learning. These science assessments emphasize students’ proficiency to use and transfer their knowledge and represent a critical piece of formal learning environments that can work in concert with curriculum and instruction to propel students’ learning.
Multidimensional Science Learning & Knowledge-in-use
Science learning involves conceptual knowledge and the practice of using this knowledge in discipline-specific ways to investigate scientific phenomena and to engineer solutions to major challenges facing individuals and communities (NRC, 2005, 2012). This focus on multiple dimensions of science learning is articulated in the National Research Council’s Framework for K-12 Science Education (NRC, 2012) and in the corresponding Next Generation Science Standards (NGSS Lead States, 2013). The NRC Framework advances two conceptual knowledge dimensions (disciplinary core ideas and crosscutting concepts) and a practice dimension (science and engineering practices) that underlie how scientists and engineers use their knowledge in discipline-specific ways. Such perspectives emphasize the goal of knowledge-in-use (Harris et al., 2019) and therefore have implications for both how to conceptualize students‘ multidimensional learning and how to measure such learning.
Enlarge…
For students to demonstrate their knowledge-in-use, assessment contexts must enable students’ active processing and effectively elicit evidence of students’ multidimensional proficiencies. Such assessment contexts require intentional, careful designs to enable students to engage in these complex, multidimensional performances as they produce their responses. As an example of the measurement challenge, one Grade 5 Earth and Space Science Performance Expectation (PE) states that students should be able to analyze and interpret water data while using scientific concepts such as standard units of measurement for volume:
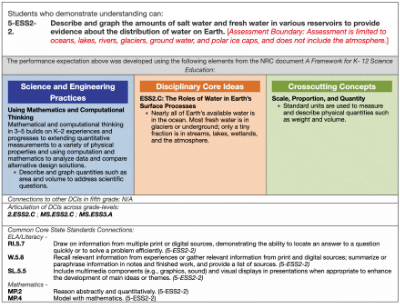
PE 5-ESS2-2: Students who demonstrate understanding can describe and graph the amounts of salt water and fresh water in various reservoirs to provide evidence about the distribution of water on Earth (see Figure 1 and/or the NGSS).

Similar to how PEs integrate these three dimensions, assessment tasks can be designed to focus on these multidimensional, integrated proficiencies (Douglas et al., 2020). Digital technology can aid in measuring these targeted proficiencies, including enabling student responses that provide evidence for these proficiencies (Gane et al., 2018).
Technology-enhanced Assessment
Technology-enhanced assessments offer potential means to augment the ways in which students can practice and demonstrate their knowledge-in-use (National Academies of Sciences, Engineering, and Medicine [NASEM], 2018; NRC, 2000). Several assessment frameworks have been proposed to characterize the range of assessments that use technology (e.g., Aldon et al., 2017; Behrens et al., 2019; Shute & Rahimi, 2017). In particular, the FaSMEd framework (Aldon et al., 2017) characterizes the formative use of technology-enhanced assessments as a multidimensional space defined by three dimensions: agent, technology function, and formative assessment strategy. The assessments we describe in this paper focus on teachers and students as agents, technology functions that enable the interactive assessment environment, and how these assessments enable formative assessment strategies such as eliciting evidence of students‘ proficiencies and providing feedback that supports learning.
Such assessment frameworks highlight the range of cognition and activity enabled by technology-enhanced assessments. These considerations are critical because they offer the opportunity to richly measure students’ ability to engage in the complex and multidimensional thinking that is embodied in the learning goals. Compared to “paper-and-pencil” assessments, technology-enhanced assessments can expand the types of information that can be presented to students and the range of responses possible, improving assessments’ potential to reflect the targeted knowledge, skills, and abilities (Behrens et al., 2019; Fjørtoft, 2020; Pead, 2012; Ryoo & Linn, 2015; Shute & Rahimi, 2017). Because assessment is always a process of making inferences from a constrained set of observations (Pellegrino et al., 2001), bringing those observations closer to the targets of interest reduces the “inferential distance” required and may thus improve validity (Behrens et al., 2019; Fjørtoft, 2020).
Effective Design
Although technology-enhanced assessments can reduce inferential distance and improve validity, capitalizing on such opportunities requires careful design. Technological enhancements can use multimedia to present information in multiple modalities and allow learners to respond in ways beyond written or typed responses. Digital assessment tasks can thus provide opportunities for students to demonstrate their multidimensional knowledge, skills, and abilities in ways that traditional paper-and-pencil assessments cannot. Such affordances (Norman, 1988) should be intentionally designed into the technology-enhanced assessments to enable students’ engagement in the task while ensuring that engagement will effectively elicit evidence of their relevant knowledge, skills, and abilities. Principled assessment design methods can increase the likelihood that the appropriate affordances are identified and included.
Considerations for effective technology-enhanced assessment design echo many considerations for digital learning environments. Prior research on effective learning designs has considered how learners process and represent information and how such cognition is affected when learning complex, interconnected concepts that are presented in multiple media. Cognitive Load Theory (Sweller, 1994; Sweller et al., 1998) and the Cognitive Theory of Multimedia Learning (Mayer, 2020) have strong implications for the design of educational technologies. Framed in terms of learning (rather than assessment), Mayer lists three goals for multimedia instruction, “reduce extraneous processing, manage essential processing, and foster generative processing” (Mayer, 2020, p. 29). These goals map onto the three types of “cognitive load” that learners may encounter when learning: extraneous, intrinsic, and germane. Learning designs are effective when they support learners’ germane and intrinsic (essential) processing while minimizing extraneous processing (Sweller et al., 1998). Stated in terms of assessment, an effectively designed assessment elicits the construct of interest (e.g., recruiting germane and intrinsic/essential processing) while minimizing construct-irrelevant variance (e.g., extraneous processing). Doing so can help ensure that the learner is accessing and applying the target knowledge, skills, and abilities while minimizing the learner’s need to use and apply any knowledge, skills, and abilities that are outside the scope of the assessment. Many of these same instructional design principles and considerations are important for ensuring construct validity in assessment (Messick, 1989). As we discuss in later sections, we used principles and heuristics informed by these instructional design frameworks to help ensure that the technology features are used appropriately to elicit and measure our constructs of interest.
Instructionally Supportive Assessments
Using information from assessments to support classroom-based ongoing teaching and learning is a common formative assessment practice (Bennett, 2015; Black & Wiliam, 2009). Formative assessment refers to specific ways in which teachers elicit and then use evidence of what students know and can do to adjust their ongoing instructional decisions (Bennett, 2011; Broadfoot et al., 1999; Pellegrino, 2020; Shepard, 2008; Wiliam, 2011). Formative assessment does not denote a specific type of assessment, but instead refers to a process of using evidence from assessment purposely to inform and/or modify future teaching and instruction (Pellegrino, 2020; Popham, 2008; Wiliam, 2013). For a classroom-based formative assessment practice to support ongoing teaching and learning, both its content and form should align with the goals set for student performance and provide students the agency to generate evidence of their progress toward those goals (Harris et al., 2019; NRC, 2000; Pellegrino et al., 2001). Feedback is a critical component of this process for both students – to understand their performance – and for teachers – to use evidence of student performance to modify instruction.
In a classroom context, formative assessment can be implemented on a spectrum ranging from formal to informal assessment and curriculum-embedded to curriculum-agnostic (Furtak et al., 2008; Shavelson et al., 2008). In all cases, however, for assessment to support instruction, teachers need to be able to use the assessment results to gather feedback on students’ proficiencies and use it to adjust their instruction (Pellegrino et al., 2016). For classroom-based assessments to effectively support teachers in this way, their designs need to be sensitive to classroom experiences and instructional goals (Ruiz-Primo et al., 2002), align with the established curricular goals (e.g., the NGSS), and enable interpreting students’ performance in relation to these goals.
The vision for science teaching and learning outlined in the Framework (NRC, 2012) and the NGSS (NGSS Lead States, 2013) requires that assessments – even those used formatively – enable students to engage in complex scientific practices (e.g., writing an argument, testing scientific ideas, conducting investigations, etc.) in the context of core disciplinary knowledge and crosscutting concepts (NRC, 2014). Using such tasks in the classroom to advance students’ learning requires that teachers engage in assessment practice that (1) supports student engagement with the knowledge, skills, and abilities identified in (or are precursors to) the targeted PE, (2) collects evidence of student performance in terms of their ability to use those knowledge, skills, abilities, and (3) uses that evidence to generate feedback and inform instruction that can further advance students’ science learning.
Design Frameworks for Multidimensional Science Assessments
For NGSS-aligned classroom assessments to support ongoing science instruction they need to provide teachers with evidence of students’ ability to use the science and engineering practice (SEP) in the context of the disciplinary core idea (DCI) and crosscutting concept (CCC) specified in a performance expectation. A principled assessment design approach can help designers determine the essential and assessable components of the knowledge-in-use learning goals, and create assessment tasks that can provide teachers feedback on their students’ progress toward those goals (NRC, 2014). And yet, while some publications share science assessment design frameworks and methodologies (e.g., Fine & Furtak, 2020; German, 2019; Harris et al., 2019; Penuel et al., 2020) aligned with the NRC Framework (and the NGSS), none illustrate specific, persistent challenges that arise when developing multidimensional science tasks while using such design frameworks.
In this paper, we aim to (1) share two design challenges and solutions that exemplify the issues that we faced when designing in this space and (2) illustrate the flexibility required to address these challenges (and the corresponding trade-offs associated with doing so) when working within a principled assessment design framework.
Design Methodology: Frameworks, Alignment, and Managing Tradeoffs
Our design process adopts an evidence-centered design (ECD) approach that is tailored to instructionally supportive assessments aligned to the NGSS (Harris et al., 2019). This alignment is critical as it reflects on the content and construct validity of the assessment tasks, and is also important for using such tasks to promote changes to classroom instruction and assessment.
Evidence-Centered Design (ECD)
Drawing on the notion of assessment being a process of reasoning from evidence (NRC, 2014), we adopted the ECD framework (Mislevy et al., 2003; Mislevy & Haertel, 2006) to design the assessment tasks and other supporting resources in this project. The evidentiary base emphasized in the framework seeks to draw logical relationships between (1) claims about the focal knowledge, skills, and abilities (KSAs) that students need in order to be considered proficient, (2) evidence statements articulating the observable aspects of student performance that provide evidence they can use the KSAs, and (3) task features that would elicit such student performance (Harris et al., 2019; Pellegrino et al., 2014).
In the first step of this design process, we select a NGSS PE (a comprehensive, summative goal for assessment) and systematically “unpack” each PE dimension and then “repack” aspects of each dimension into a set of learning performances (see Harris et al., 2019 for further details). A learning performance is a knowledge-in-use claim statement that is smaller in scope than a PE and represents a portion of the disciplinary core ideas, science practices, and crosscutting concepts that students should develop as they build proficiency toward the PE. For example, we used the previously discussed PE (see Figure 1) to generate three learning performances (see Table 1). Collectively, the set of learning performances represent necessary proficiencies that students should develop (and demonstrate) as they make progress towards proficiency with a PE. In the next step we identify the KSAs that are constituents of the learning performance claim. From these KSAs we then articulate a set of evidence statements that specify the observable features in students’ work products that are relevant to making judgements about students’ proficiencies with the KSAs (see Table 1 for examples). In the final step we use the evidence statements and task features to design the set of assessment tasks (and accompanying rubrics) aligned with each learning performance. A key requirement for the design of NGSS-aligned assessment tasks is that they utilize a real-life phenomenon to center the problem and provide students the opportunity to engage with the integrated dimensions in a deep and authentic way. Technology enhancements can play a major role in achieving such requirements.
Alignment to Standards
Validity, in the broadest sense, refers to whether the assessments measure what they purport to measure. Earlier conceptualizations of validity attempted to parse out types of validity, for example, content validity (Do the topics/foci of the assessment match what is intended to be assessed?) and construct validity (Does the assessment measure the hypothetical construct(s) of interest?) (Messick, 1989). Content and construct validity can both be conceptualized as related to the alignment between what the assessment measures and the learning goals/measurement targets for which the assessment should provide evidence. Alignment is important for multiple reasons: (a) assessments are a critical signal to teachers and students about expectations regarding what students should know and be able to do (Pellegrino et al., 2001; Wilson, 2018), (b) formative assessment requires that assessments yield useful feedback with respect to students’ progress in developing the specific constellation of knowledge and skills in the targeted proficiencies (Heritage, 2010; Pellegrino et al., 2001, 2016; Pellegrino, 2020), and (c) assessments must guard against construct under-representation and construct-irrelevant variance (Messick, 1989).
Contemporary theories of validity often center on an argument-based approach to validity in which the purpose and use of the assessment are evaluated as is the evidence assembled to support the purpose and use (American Educational Research Association [AERA] et al., 2014). Alignment remains critical in an argument-based approach to validity. It is incumbent on assessment developers to specify the intended interpretive use of students’ performance/scores on the assessments, as well as assembling evidence to support those interpretive uses. Our ECD process produces documentation about this alignment. In addition, during task development and review we continually focus on this alignment to ensure that the tasks developed fully represent the construct(s) of interest without introducing significant construct-irrelevant variance.
These alignment and validity considerations inform aspects of our design process. Each performance expectation has a set of learning performances and each learning performance constitutes a “family” of assessment tasks (we typically develop two or three assessment tasks per learning performance, but more could be developed). An implication is that multiple tasks use the same evidence statements. Therefore, evidence statements need to be comprehensive while also being flexible enough to allow for multiple tasks that use different contexts. Further, each task should be designed to elicit all the evidence (in the form of students’ responses) specified in the evidence statements. During task development we continually evaluate and revise to improve the alignment between (a) the learning performance’s multidimensional claim statement and the KSAs, (b) the KSAs and the evidence statements, and (c) the evidence statements and the task.
Designing under constraints: Inherent trade-offs
Developing assessment tasks requires managing a variety of explicit and implicit design constraints. Practical constraints arise from when, where, and how assessments will be used in the operational environment (e.g., the classroom). Assessment designers often confront trade-offs between ideal versus practical design decisions. Making careful, intentional trade-offs can allow a designer to minimize negative outcomes of these constraints. Two examples illustrate how constraints can limit assessment task designs. First, because these assessment tasks are intended to be used in classrooms for formative purposes, the tasks cannot require too much time for students to complete. This limits the number of prompts included in any single task and the depth of the expected student response. Second, the tasks cannot use technology-enhanced features that require a significant time for students to learn to use. Because our tasks are designed to be used as supplements to existing curriculum and instruction, we do not assume that teachers will devote substantial class time for students to learn a specific digital tool or interactive that is used in a single assessment. For example, while the assessment authoring system we use can embed a powerful custom data analysis tool (Finzer & Damelin, 2016) within tasks, un-scaffolded use of the tool has substantial prerequisite data analysis knowledge and skills related to system-specific ways and means of analyzing data. The complexity of the tool, while useful when embedded in continued learning activities over time, makes it challenging to use as a single assessment task when students do not have prior experience with it.
These example trade-offs are not specific to science but are more likely to occur when developing assessment tasks that measure knowledge-in-use. Irrespective of which principled assessment framework is used, it must be flexible enough to allow designers to develop creative solutions for successful designs within these constraints and provide ways to navigate and manage these trade-offs.
Iterative design
To manage constraints and balance trade-offs we use short design-critique-iterate cycles to first develop tasks “on paper”. These cycles usually also include iterating the backbone of our learning performance design: claims, evidence statements, and task features. In these cycles, task developers flexibly move back-and-forth between design stages, allowing design decisions in later stages to modify earlier stages and ensuring that modifications in earlier stages propagate forward to later stages to maintain alignment. Once the learning performances and tasks have been specified “on paper”, there can be further iteration as each task is rendered in a digital format with any technology-enhanced interactive components. The team doing the technological work has significant science, teaching, and assessment experience, so tasks get an additional review as they are created in the task authoring system. Comments and suggestions are shared with the task designers, and a draft implementation of the task is rendered. Dialogue between the task designer team and the task rendering team enables further task refinement and ensures an appropriate translation from the design “on paper” to its implementation and publication to the task portal.
After the technology-enhanced tasks are implemented on the task portal, we organize external reviewers with varied knowledge and expertise. Their review focuses on task alignment and the user (student) interface and response design. Reviewers rate how closely a particular task aligns with its learning performance, how accurately it elicits the three NGSS dimensions, and whether it includes any language, representations, or other features that may make it difficult for specific student groups to comprehend, access, or respond to it. Reviewers also provide feedback on whether the learning performance claim statement, KSAs, and evidence statements are multidimensional and whether they comprise an essential part of what students need in order to develop proficiency with the performance expectation. Task designers use this reviewer feedback, along with any teacher feedback, to revise the tasks and/or learning performances.
In our design framework, alignment across claims, evidence, and tasks is paramount, however, designers have flexibility in defining all three. Table 1 provides the final set of claims and evidence statements that we carefully crafted to lay the foundation for a set of distinct, engaging tasks for the PE. The claims (both the learning performance statement and the KSAs) were revised multiple times, as needed to develop a set of tasks appropriate for this performance expectation and elementary classrooms. The learning performances were refined especially with respect to the scope of the DCI. The feasibility involved in realizing some task designs caused us to refine the evidence statements; such changes propagate backward, requiring changes to the KSAs and the learning performance’s claim statement. In the next section we provide detailed examples of two design challenges and how we addressed them within our design framework.
Navigating Design Challenges: Attending to Key Considerations and Capitalizing on Flexibility in the Design Framework
We share two examples of challenges that can arise when developing technology-enhanced, knowledge-in-use assessment tasks, even while using a principled assessment design framework. While our framework guides and structures task development, it does not provide ready-made solutions to all challenges. Instead, the framework provides a foundation upon which design challenges and trade-offs can be considered and then managed while creating usable assessment tasks. Although our examples draw from science, these challenges can occur in other disciplines when developing multidimensional and/or technology-enhanced assessment tasks. In sharing these examples, we explicate our design considerations and decisions to illustrate how we navigated these trade-offs while operating within our framework and ensuring alignment to learning goals.
Our examples draw from task development work for one Grade 5 PE (5-ESS2-2, shown above). Our first example concerns assessing multidimensionality when some dimensions are in conflict. Our second example concerns using technology to enable or enhance our ability to measure multidimensional, knowledge-in-use learning goals.
Before sharing these examples, we note a peculiarity of this PE: It has a narrow disciplinary core idea (DCI) scope. The DCI (see Figure 1) includes relative amounts of water at the global level, distinguishing between saltwater and freshwater and associated reservoirs for each. This narrow scope is not necessarily problematic if creating only one task, but the scope makes it difficult to create a set of tasks. How can one create a set of meaningfully engaging, distinct tasks that allow students to make sense of phenomena when distribution of water can only be considered at the global level?
A key feature of our design framework is unpacking the DCI, parsing the conceptual space of that unpacked DCI, and then using different portions of that conceptual DCI space in different learning performances (Harris et al., 2019). This procedure allows flexibility in representing and parsing the DCI space, as long as it is sensible and does not go beyond the PE DCI (i.e., does not assess disciplinary knowledge beyond the DCI). One way we addressed this narrow DCI scope when developing our learning performances was by omitting the qualifier “Earth’s,” which would have imposed a strong constraint on what tasks would be possible. Table 1 shows all three learning performances. None include the qualifier “Earth”. Omitting “Earth” allowed us to develop tasks that could focus on either global or more regional water distributions. Each learning performance has at least one task that focuses on water at the global level and at least one task that focuses on water distribution at a regional level. Critically, for tasks focusing on regional water distributions, tasks were designed so that students did not have to “know” (i.e., recall) amounts of water in these specific regions. Instead, the task provides information about water in these regions, which is then used by students as they engage with the other two science dimensions to make sense of a phenomenon.
Challenge 1: Inherent Conflicts in Multidimensionality
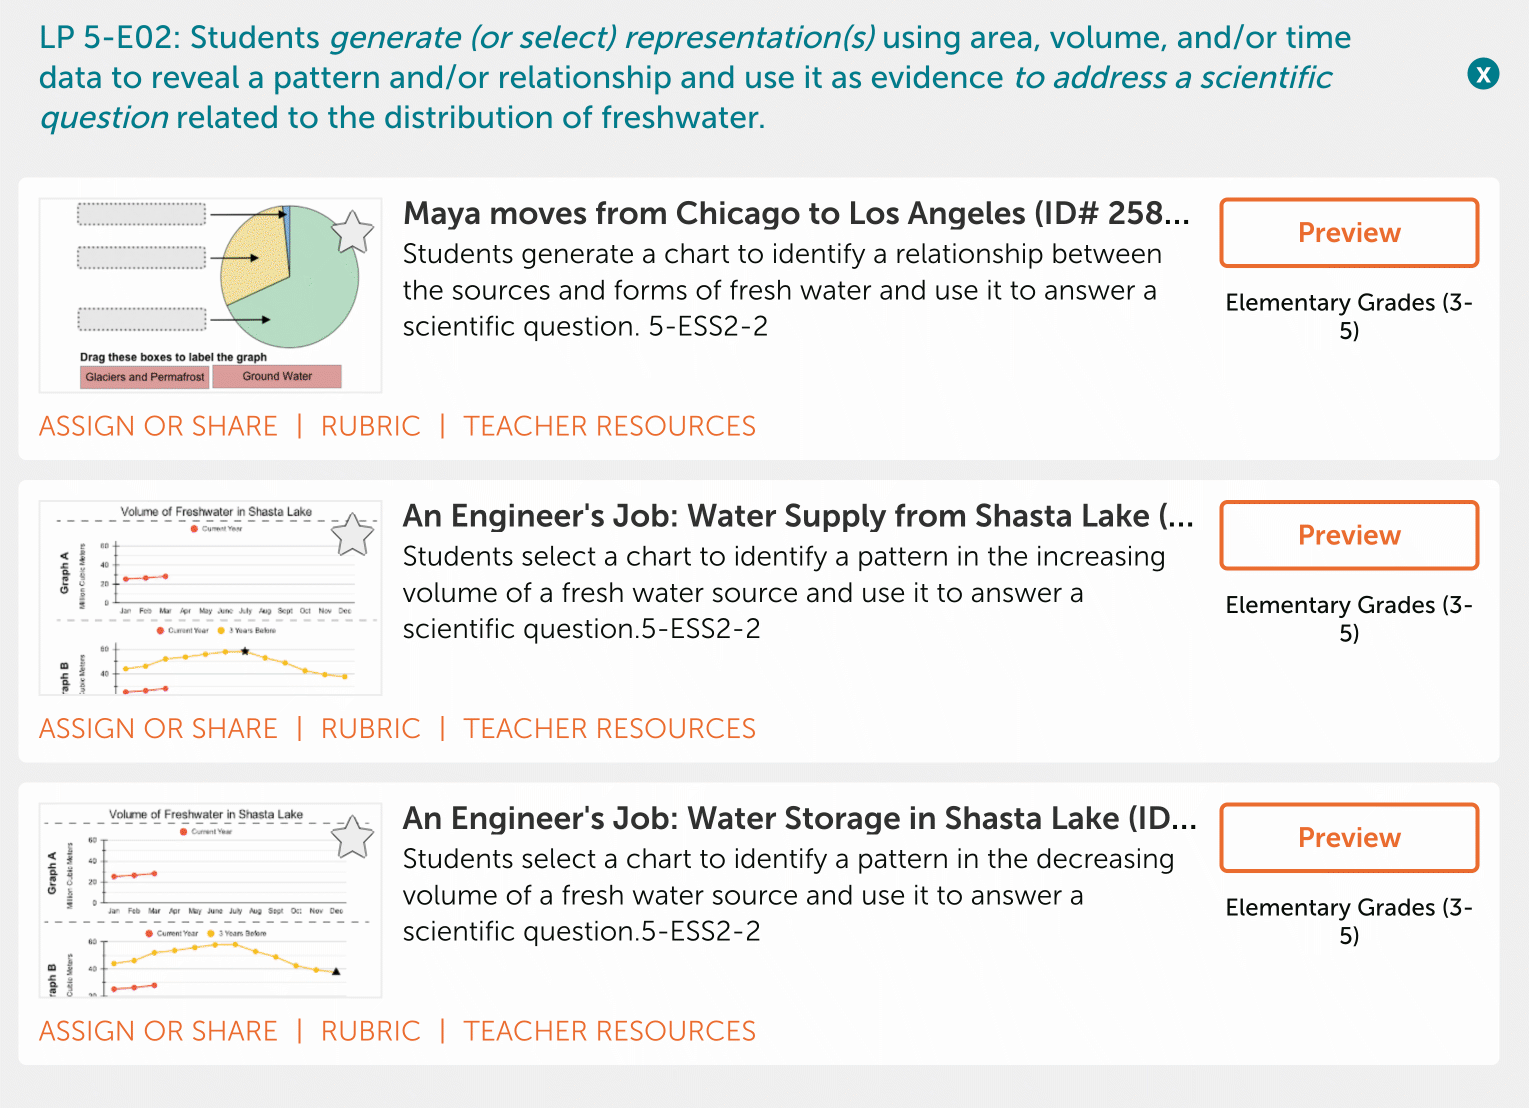
In certain PEs, integrating the specific aspects of the dimensions can create potential conflicts when designing assessment tasks. Our first example illustrates the challenge that can arise when two or more dimensions come into conflict when combined. Learning Performance 5-E02 specifies that students can generate (or select) representation(s) using area, volume, and/or time data to reveal a pattern and/or relationship and use it as evidence to address a scientific question related to the distribution of freshwater (see Table 1). The DCI dimension covers knowledge about the distribution of freshwater sources on Earth and their forms (e.g., glacier (ice), lake (liquid), etc.). The SEP (science and engineering practice) dimension requires students to use that knowledge to generate a data representation and to describe a pattern or relationship in that representation. The CCC (crosscutting concept) dimension requires students to use the identified pattern or relationship as evidence to explain a phenomenon (or make a prediction) related to distribution of freshwater.
Learning Performance 5-E02 focuses on freshwater reservoirs. Taking the PE’s assessment boundary (see red text in Figure 1) into consideration, we were limited to considering only three sources of freshwater: glaciers and permafrost, ground water, and surface water. Further, although informational sources and scientific data on these freshwater sources is typically provided in either percentages or large numbers, the PE’s DCI uses only qualitative descriptors of volume (e.g., “very large”, “only a tiny fraction”, etc.) (see Figure 1). That type of qualitative knowledge of the volume of reservoirs is challenging to integrate with the other two learning performance dimensions (SEP: Mathematics and computational thinking; CCC: Patterns) in a meaningful way. How can one create tasks that require students to “...graph quantities…to address scientific questions” (SEP) when students are not expected to know any numerical quantities (DCI)?[Endnote 1] Further, how can one create tasks that require students to identify and use a pattern (CCC) in a data representation of only qualitative, global freshwater data? We had to avoid designs where all tasks embedded the target freshwater knowledge for students. Doing so would have enabled their use of the SEP but at the cost of obviating the DCI dimension. Our solution uses the flexibility in our framework to develop learning targets (i.e., learning performances and associated KSAs) that are broad enough to allow for a range of task designs, creating multiple tasks that vary in key respects while still maintaining alignment with the broader assessment targets.
Our Solution: Emphasizing and “Backgrounding” Dimensions
In ECD, the assessment targets (e.g., learning performances, KSAs) are defined first, then tasks are designed to provide evidence for whether the student has demonstrated proficiency with those targets. When these assessment targets are multidimensional, it is possible to consider unequal weighting of the dimensions: Students still use all three dimensions, but one or two dimensions might be emphasized while the remaining dimension(s) might be “backgrounded”. In this way, students are still engaged in multidimensional thinking and reasoning, but the strongest determinant of their performance might hinge on one dimension, rather than equally on all three. We use Learning Performance 2 to illustrate this solution and present two examples to demonstrate that individual tasks can vary in their emphasis on different dimensions yet maintain alignment to the same assessment targets.
Two example tasks are given in part in Figure 4 and fully on websites. The two tasks— Maya Moves from Chicago to Los Angeles and An Engineer’s Job: Water Supply from Shasta Lake—were developed from the same learning performance and therefore have the same KSAs and evidence statements. Table 1 lists the KSAs and evidence statement for Learning Performance 2 and shows that to demonstrate proficiency in the learning performance, students must be able to generate (or select) data representation(s) of area, volume, and/or time to reveal a pattern and/or relationship, and use that to address a scientific question related to the distribution of freshwater.
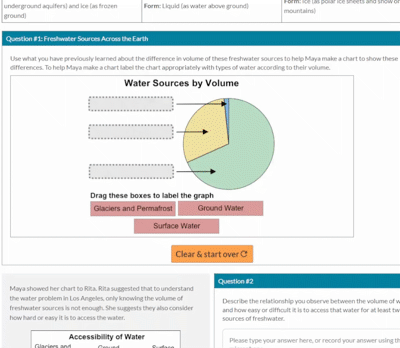
Play…
This demonstrative evidence is elicited in the Maya Moves from Chicago to Los Angeles task by expecting students to first use their prior (DCI) knowledge about the relative volume of the three global freshwater sources to label a pie chart. The technology-enhanced task uses a pie chart with three segments; each unlabeled segment is sized relative to the amount of total freshwater in each global water reservoir listed in the PE. Students do not need to know exact amounts (in volume or percentages) but instead drag-and-drop labels based on their knowledge of the relative volume of these reservoirs to create a scientifically accurate pie chart (see Video 1 in online article). Students then identify and describe a relationship between the volume of the global freshwater sources and how easy or difficult it is to access them using their labeled pie chart and a second illustration showing the accessibility of these global freshwater sources. Finally, students use the identified relationship to answer a scientific question about why residents in Los Angeles have access to less freshwater than residents in Chicago.
Enlarge…
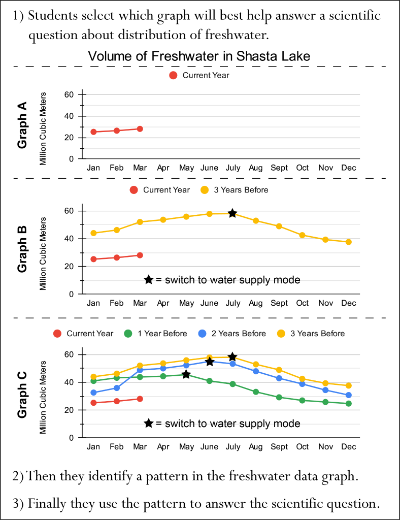
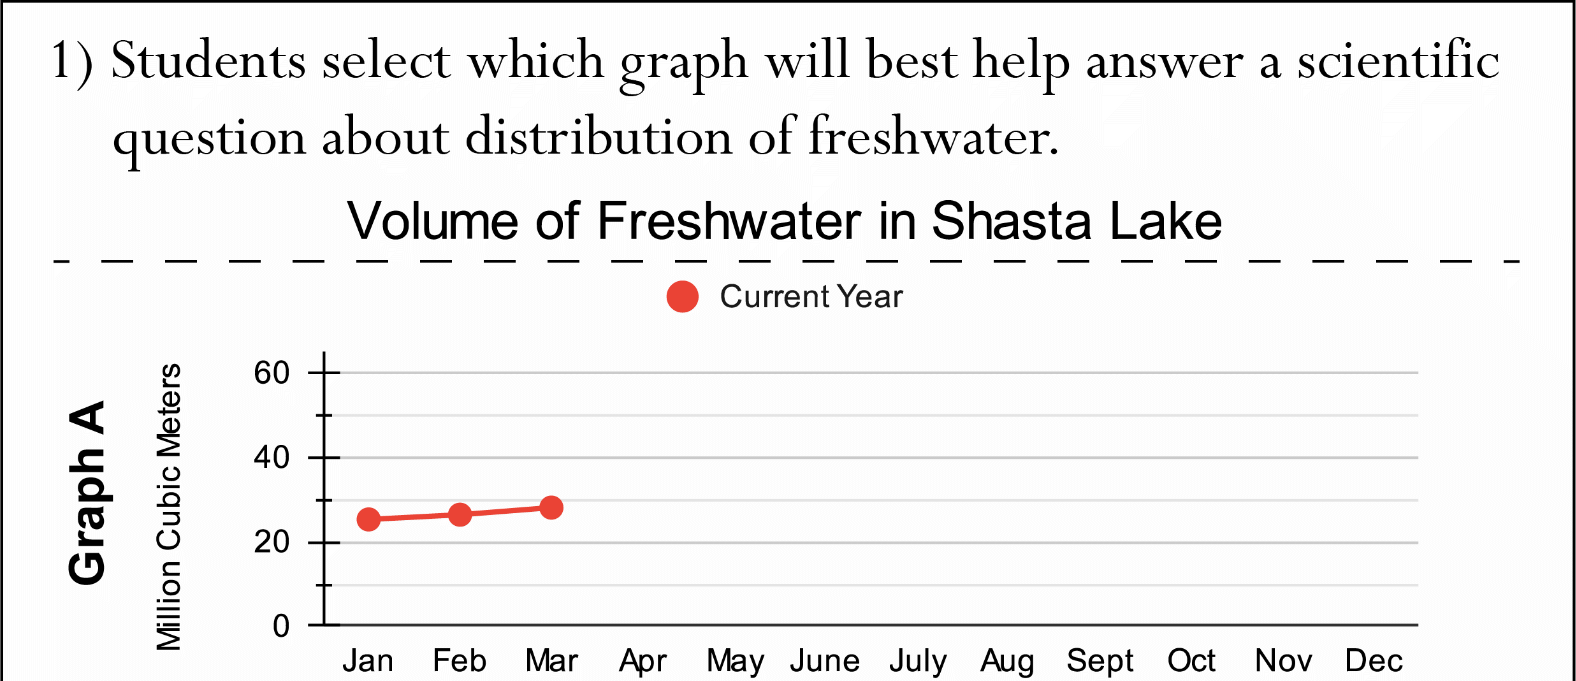
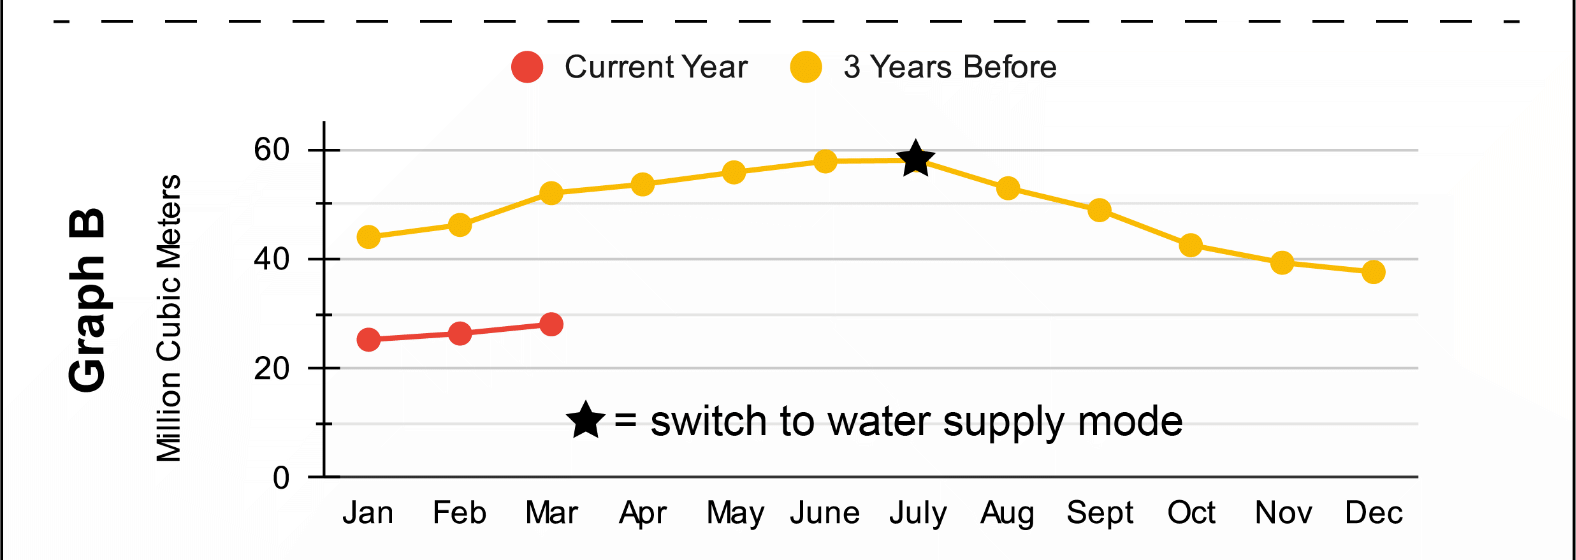
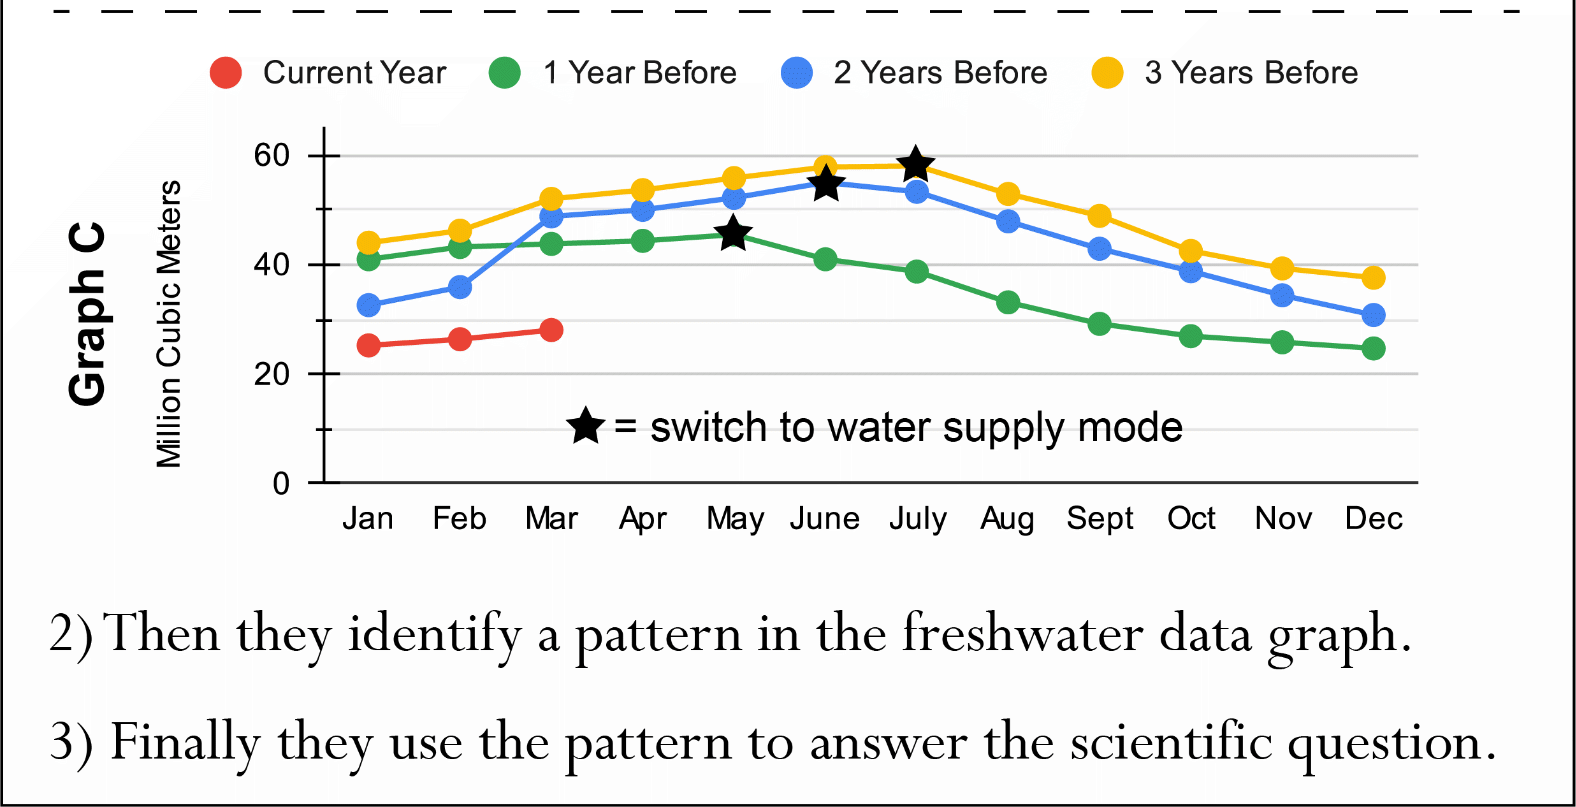
Contrast that evidence with the evidence elicited in the task An Engineer’s Job: Water Supply from Shasta Lake. This task uses regional freshwater data and emphasizes the SEP. Students first use their understanding of grade-appropriate data representations and select the graph that will be most helpful to answer a scientific question about when Shasta Lake will be “switched” to water supply mode this year (see Figure 2). Students then identify and describe a pattern in the data on the volume of water in Shasta Lake. Finally, students use the graph and pattern to answer the scientific question posed in the task scenario. Task performance hinges on students’ facility with using freshwater data representations to identify a pattern and use that pattern to answer a scientific question. Students must reason with freshwater volume data but are not required to demonstrate their knowledge of the relative amounts of global freshwater.
Despite their different emphasis, both tasks are aligned to the same learning performance and KSAs. Both tasks elicit students’ ability to generate or select appropriate representation(s) of data on the distribution of freshwater, describe a pattern and/or relationship observed in that data representation, and use the identified pattern and/or relationship to answer a scientific question related to the distribution of freshwater.
Our principled design approach requires that knowledge-in-use tasks are three dimensional but allows for variation in how the dimensions are emphasized in order to foster students’ deep and meaningful engagement in scientific sensemaking and problem solving. This flexibility arises in part because each learning performance describes a set of tasks. Because our design approach is rooted in classroom assessment, these principled variations allow educators to selectively use one or more tasks based on how well they fit with the educators’ instructional emphasis and students’ opportunities to learn.
Challenge 2: Using Authentic Data and Graphing Tools without Overwhelming Students
With the NGSS’ focus on students making sense of phenomena and solving scientific problems, performance tasks must allow students to engage in multidimensional performances that reflect complex scientific practices. Like the PE, Learning Performance 5-E01 (see Table 1) focuses on generating and/or using data representations. In this section we describe how technology complements our ECD approach, focusing on how we use technology to design age-appropriate assessment tasks that elicit the multiple scientific dimensions via engaging scientific phenomena, authentic data, and scientific practices. Because our solutions relied heavily on technology-enhancements, we used design heuristics to address multimedia and cognitive load issues that surfaced during design. We strove to eliminate extraneous load from the tasks while focusing students on the reasoning intrinsic to the constructs of interest (i.e., we aimed to minimize threats to validity).
Tasks Graphing Water on Earth and Saltwater in Coastal and Midcontinent Aquifers (hereafter referred to as Saltwater in Aquifers) were developed from Learning Performance 5-E01 which has two KSAs (see Table 1). KSA1 requires students to generate and/or describe data representations using quantitative data (and standard units) that illustrate the amount of saltwater and freshwater in a region (globally, or a specific locale). KSA2 requires students to describe the appropriateness of a representation for addressing the scientific question. Tasks developed from these KSAs therefore involve the generation, interpretation, and/or evaluation of data representations for the purpose of addressing scientific questions. However, achieving such requirements with authentic data and phenomena runs the risk of introducing substantial construct-irrelevant variance.
Authentic Data
The Graphing Water on Earth and Saltwater in Aquifers tasks use authentic data representing various forms and amounts of water. Ensuring these data are accessible to upper elementary students while still adhering to the KSAs is challenging because water data are often measured in cubic kilometers (or acre-feet) and the volume of these water reservoirs can span thousands to over a billion cubic kilometers for the sea. Although upper elementary students‘ understanding of volume measures (and units) is appropriate according to commonly used U.S. mathematics standards (http://www.corestandards.org/), the sheer quantity of water could introduce opportunities for error.
As an example of this challenge, consider a seemingly straight-forward task design in which students use a calculator (or pencil-and-paper) and basic arithmetic to combine disaggregated data and then graph the resulting, aggregate data. While the arithmetic may be grade-appropriate, those calculation skills are not a core requirement of this learning performance and might detract from the science proficiencies being measured, especially for students that are prone to calculation errors or are still developing their mathematics skills. Adding water data with a calculator and paper when each data point can have up to 10 place values provides multiple opportunities for calculation errors. Such errors could prevent students from answering the tasks appropriately, thereby introducing construct-irrelevant variance into the assessment. For example, students who can generate scientific data representations might nevertheless generate an incorrect graph because of a calculation error and then use their incorrect graph when attempting to address the scientific question. Alternatively, providing already-summed numbers for students to then graph runs the risk of removing the depth of students’ reasoning because they are merely translating a numerical format into a graphical format (i.e., resulting in construct-underrepresentation).
Graphing Tools
While technological enhancements can offer tools for students to make graphical representations (while also minimizing some challenges of working with authentic data) they run the risk of introducing extraneous load. Returning to the KSAs for this learning performance (see Table 1), the tasks need affordances for students to actively reason about and engage with water data in appropriate ways to answer scientific questions about water on Earth. The tool itself should not impose substantial cognitive load: Students must be able to focus on reasoning with data, not how to operate the tool. Creating a tool with a low barrier to entry is critical. Teachers should not need to spend limited classroom time teaching students how to use a graphing tool embedded in an assessment task. Similarly, students should not be burdened with figuring out how to use a complicated tool just to complete the assessment task. Doing so would likely introduce construct-irrelevant variance, detracting from measurement of the intended proficiencies.
Play…
Enlarge…
Our Solution: Low Barrier to Entry Technology Enhancements that Avoid Large-Number Arithmetic
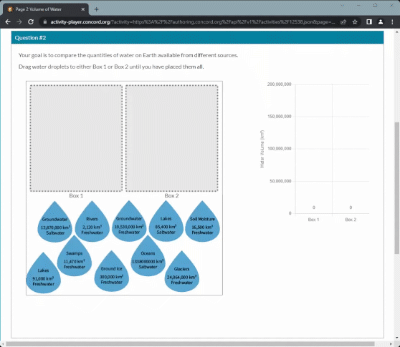
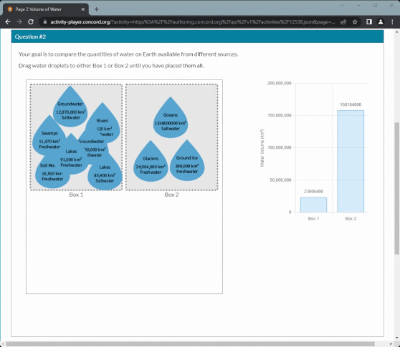
As we explored ideas for task designs for this learning performance, we developed an interactive bar graph tool that could be used in both tasks. The intent of this interactive was to give students opportunities to easily generate data representations while manipulating authentic water data. Video 2 (see online article) demonstrates this tool as embedded in the Graphing Water on Earth task. (Similar use is shown in Figure 3.) In the task students create a bar graph that illustrates the different amounts of saltwater and freshwater sources on Earth. This interactive lets students drag-and-drop water droplets that represent specific sources, amounts (in standard units), and types of water on Earth, in order to dynamically build bar graphs. Dropping a water droplet in a box adds that source’s water quantity to the respective bar in the graph. The tool avoids a need for students to complete arithmetic calculations by hand (or by calculator). Doing so eliminates the potential for unnecessary errors arising from complex graphing software or calculation mistakes which could obscure measurement of the KSAs. Furthermore, the ease with which students can create and modify their bar graphs is an affordance of the interactive that is difficult to achieve with paper-and-pencil. Using the interactive, students can easily try different combinations without the need to recalculate each time.
Play…
This tool allows students to aggregate the various sources (and amounts) of water on Earth in whatever ways they deem appropriate. Note the intentional design choice of leaving the boxes unlabeled. Students must decide how to organize the water data into two categories that are appropriate for answering the scientific question underlying the task. Students might think they should put all lakes, rivers, swamps, and groundwater in one box and oceans, glaciers, and ground ice in the other (see Video 3(see online article)). Such categorization could reveal alternative conceptions about the type of water in each source or what data would effectively answer the scientific question. If the boxes were pre-labelled “saltwater” and “freshwater” then the task reduces to simply matching labels in droplets to box labels, eliminating evidence for the KSAs.
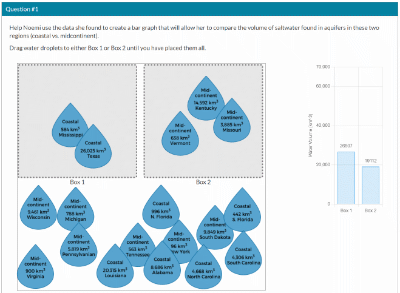
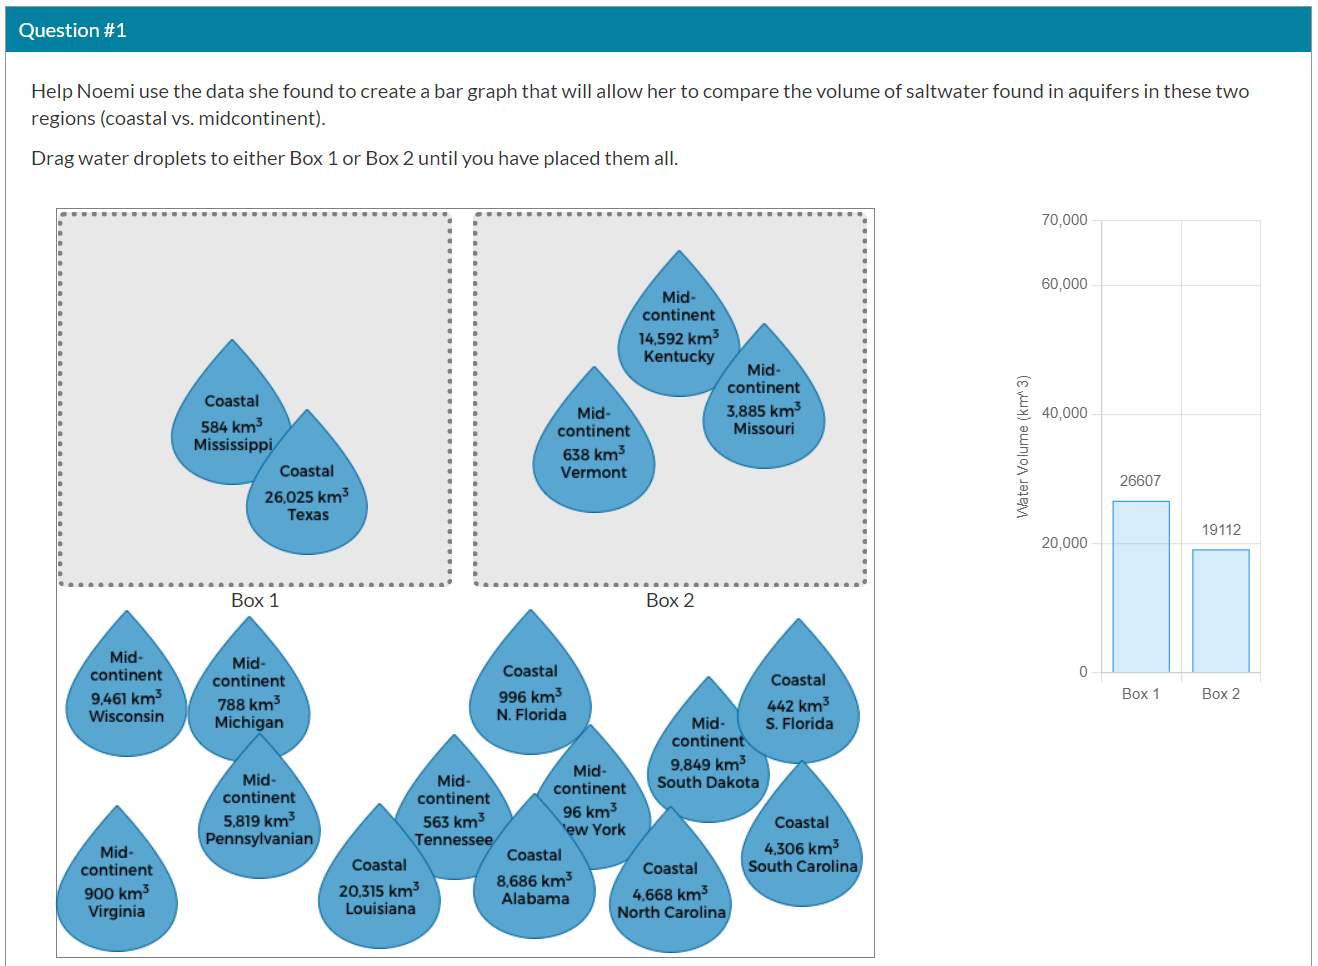
We also used this drag-and-drop graphing tool in the Saltwater in Aquifers task (see Figure 3). Students manipulate 18 distinct water droplets to aggregate and visualize authentic data in a way that helps them answer the task’s underlying scientific question about saltwater and freshwater distribution in U.S. aquifers. In both tasks the interactive tool allows students to demonstrate their ability to “generate data representations using quantitative information (in standard units) of the amounts of saltwater and freshwater” (KSA1). Although not visible in the videos, after creating their data representation students use it “to address a scientific question about types of water (salt & fresh) and the relative amounts of each” (KSA2).
The interactive bar graph tool enhanced the ways in which tasks could elicit evidence for multiple dimensions. It allowed us to develop tasks that use complex, real world data while providing elementary students with a grade appropriate tool for manipulating and visualizing complex water data. Thus, the interactive enables assessment task designs that afford use of the three dimensions of the learning performance.
In sum, we used our evidence centered design process and technology to afford students with opportunities to demonstrate the KSAs we aimed to measure. Adhering to the guardrails of assessment validity (i.e., ensuring that the tasks are meaningfully multidimensional, while not underrepresenting the construct nor introducing significant construct-irrelevant variance) requires creative balancing and navigating trade-offs to realize the dimensions through task design.
Evaluating Whether We Successfully Overcame These Design Challenges
In this section we consider whether we overcame our design challenges. In terms of evaluation, there are two classes of considerations. First, were we able to use our design framework (and heuristics) to develop a suite of quality, NGSS-aligned assessments? Second, do these assessments yield valid and useful scores for classroom teachers? We will focus on the first question; further studies are needed to provide sufficient evidence for the second question.
Enlarge…
We produced seven technology-enhanced multidimensional tasks for PE 5-ESS2-2 that were implemented in a web portal (see also Figure 4). Critical features of our design framework include the production of (a) a suite of tasks for each performance expectation, (b) tasks that are multidimensional, and (c) tasks that require students to “put their knowledge to use” to make sense of a phenomenon and/or address a scientific problem. In attempting to meet these features, Design Challenge 1 (limitations of the scope of the DCI and inherent conflicts in integrating specific dimensions) initially stymied our efforts to design enough different and engaging tasks. Nevertheless, we overcame those challenges and created a set of three multidimensional learning performances with two or three tasks each. Quality and appropriateness are also important. Tasks must provide teachers with information about their students’ proficiencies regarding the articulated targets (i.e., learning goals). Our continued attention to alignment, along with documentation articulating this alignment, are critical pieces of procedural evidence that our design process produced tasks that tap into the desired proficiencies. Table 1 displays a portion of this alignment; additional alignment is specified within each learning performance design document (see Harris et al., 2019). Further, each task also has an associated rubric. These rubrics help ensure that educators can make sense of their students‘ responses and make inferences about their students’ proficiencies with the assessment goals tied to the PE. Additionally, several elementary teachers participating in a larger research project have used some of these tasks with their students. Teachers reported that students had no major problems understanding the tasks and what was being asked of them, and that they were generally engaged as they completed the tasks. Although only anecdotal, this preliminary feedback is positive. Finally, we have asked several participating teachers to provide their own feedback on tasks as they considered how to use them with their students. We revised the Saltwater in Aquifers task based on specific concerns raised by those teachers. As we have previously done for other tasks posted on the web portal, in the future we will use additional feedback from teachers and external reviewers to revise and further improve the tasks.
Returning to the second question, “do these assessment tasks yield valid and useful scores for classroom teachers?” we have preliminary evidence in the form of the products of our design efforts, the design documentation, and informal feedback. More evidence including a variety of empirical data is needed to provide support for any stronger claims advanced in a validity argument (AERA et al., 2014; Pellegrino et al., 2016).
Conclusion
Considerations that Help Navigate Assessment Design Challenges
By describing our design challenges and solutions, we illustrated that while a comprehensive assessment design framework “sets the groundwork” for developing multidimensional assessments, complex design decisions will still arise. Any such framework therefore needs flexibility and processes that allow designers to surface challenges and then navigate those challenges by attending to critical, high-leverage task features and designs. In our examples, this meant task developers had to design tasks that could (a) elicit the multidimensional, integrated proficiencies, and (b) afford student performances and elicit responses that would demonstrate their knowledge-in-use. Achieving such criteria despite challenges arising from conflicting dimensions, using authentic data, and using grade-appropriate scientific tools was aided by attending to core principles and design heuristics based on theories of construct validity, multimedia learning, and cognitive load. Using two examples of such challenges in one NGSS PE, we illustrated intricacies of multidimensional assessment design that are rarely discussed in the design framework literature. By describing those examples and our solutions (and associated rationale), we aimed to provide insight and motivation to other task designers that these challenges can be overcome to create novel tasks that reflect multidimensional knowledge-in-use. Challenges in design to meet complex, forward-looking learning standards are inevitable but surmountable. The NGSS’ PEs lay out a set of claims about performances that students should be able to demonstrate through responding to assessment tasks. Evidence that all these performances can be accurately and reliably elicited and measured via assessment designs has not yet been assembled. The field of educational design and assessment needs to showcase design solutions and approaches that demonstrate how to measure all these performances and not just those that are easy to measure (Gane et al., 2018).
Generalizing Beyond this PE and these Science Standards
Our paper focuses on examples from a specific Grade 5 standard, but the two challenges we present have the potential to occur across any K-12 standard. For example, MS-LS1-7 also shows conflict in its dimensions. It requires that students develop a model that shows atoms are conserved and energy is released during chemical reactions involving oxygen and carbon, but that “details of the chemical reactions for photosynthesis or respiration” are outside of the assessment boundary. Precise and creative design are required to develop assessment tasks that will elicit the required evidence without going beyond the boundaries. Although we focus on the NGSS, similar challenges likely arise in other disciplines when learning standards require attention to both disciplinary knowledge and disciplinary practices. Because of the strong effect assessments have on classroom instruction and shaping learning goals (Pellegrino et al., 2001; Wilson, 2018), it is imperative that assessment designs match the full scope of the learning targets and standards. Failing to do so risks narrowing curricula and lowering expectations of what students can and should be able to do.
In addition to using technology-enhanced assessments to measure multidimensional learning (NRC, 2014), such enhancements also offer new presentation, interaction, and response formats. These technology-enhanced assessments can offer accommodation and support features that improve accessibility of the tasks for different students’ needs. For example, the task portal offers options for magnification, reading aloud, and recording voice/sound responses.
The educational design field should continue to design and evaluate means of enhancing assessments to broaden their measured constructs while simultaneously developing more engaging and authentic tasks for students – tasks that emphasize sensemaking and problem solving practices – instead of focusing tasks narrowly on memory recall or calculation. Principled design frameworks are needed but are not enough. Designers must also overcome difficulties for which their frameworks may not offer ready-made solutions. Sharing those challenges and solutions with the field may enable others to overcome similar challenges and motivate refinements and extensions to existing principled design frameworks.
Endnote
[1]This combination of freshwater volumes (DCI) and graphing quantities such as volume (SEP) is present in the PE (i.e., the problematic combination is not an artifact of our design choices but is instead a challenge inherent in this PE). This type of multidimensional conflict is also not unique to this PE; other NGSS PEs (e.g., MS-LS1-7) contain similar conflicts.
Appendix: Table 1
|
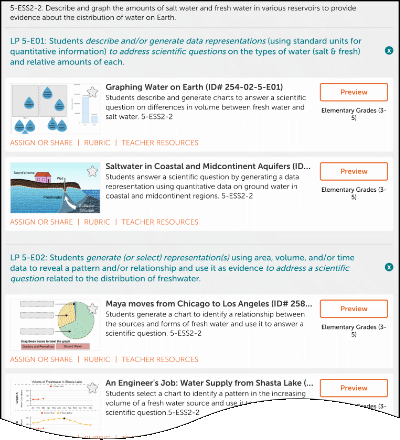
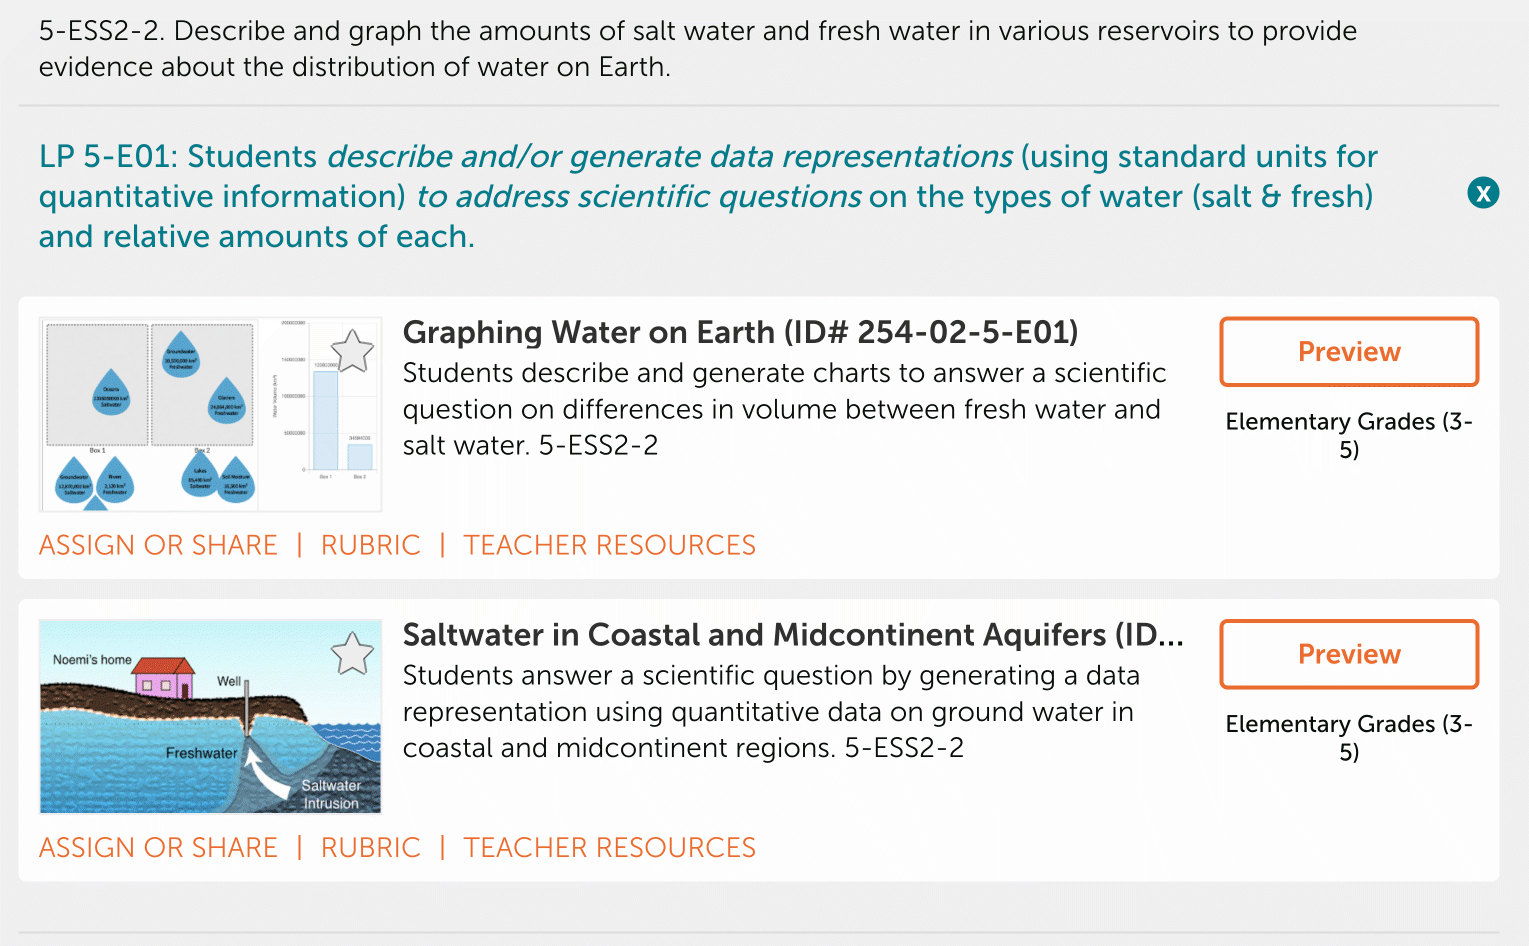
LP 5-E01: Students describe and/or generate data representations (using standard units for quantitative information) to address scientific questions on the types of water (salt & fresh) and relative amounts of each. |
SEP: Using Mathematics and Computational Thinking |
|
|
DCI: Types of water (salt and fresh) and corresponding volumes |
||
|
CCC: Scale, Proportion, and Quantity |
||
|
KSA1: Ability to generate and/or describe data representations using quantitative information (in standard units) of the amounts of saltwater and freshwater |
ES1: Students generate and/or describe data representations using quantitative information (in standard units) that illustrate the amount of saltwater and freshwater in a given locale/region (up to, and including planet Earth as the locale/region) |
|
|
KSA2: Ability to use a data representation to address a scientific question about the types of water (salt & fresh) and the relative amounts of each |
ES2: Students use a data representation to address a scientific question about the types of water (salt & fresh) and the relative amounts of each |
|
|
LP 5-E02: Students generate (or select) representation(s) using area, volume, and/or time data to reveal a pattern and/or relationship and use it as evidence to address a scientific question related to the distribution of freshwater. |
SEP: Using Mathematics and Computational Thinking |
|
|
DCI: Distribution of freshwater, including sources (i.e., reservoirs) and/or forms (i.e., liquid and solid) |
||
|
CCC: Patterns |
||
|
KSA1: Ability to generate or select appropriate representation(s) of data (area, volume, and/or time) on the distribution of freshwater |
ES1: Students generate or select data representation(s) (e.g., bar graphs, pictographs, pie charts, etc.) that are appropriate for data on the distribution of freshwater and are relevant to the scientific question |
|
|
KSA2: Ability to describe a pattern and/or relationship in data representation(s) of the distribution of freshwater |
ES2: Students accurately identify and describe a pattern and/or relationship present in the data representation(s) of the distribution of freshwater |
|
|
KSA3: Ability to use the identified pattern and/or relationship as evidence to address a scientific question related to the distribution of freshwater |
ES3: Students use the pattern and/or relationship that they identified to address scientific question(s) related to the distribution of freshwater |
|
|
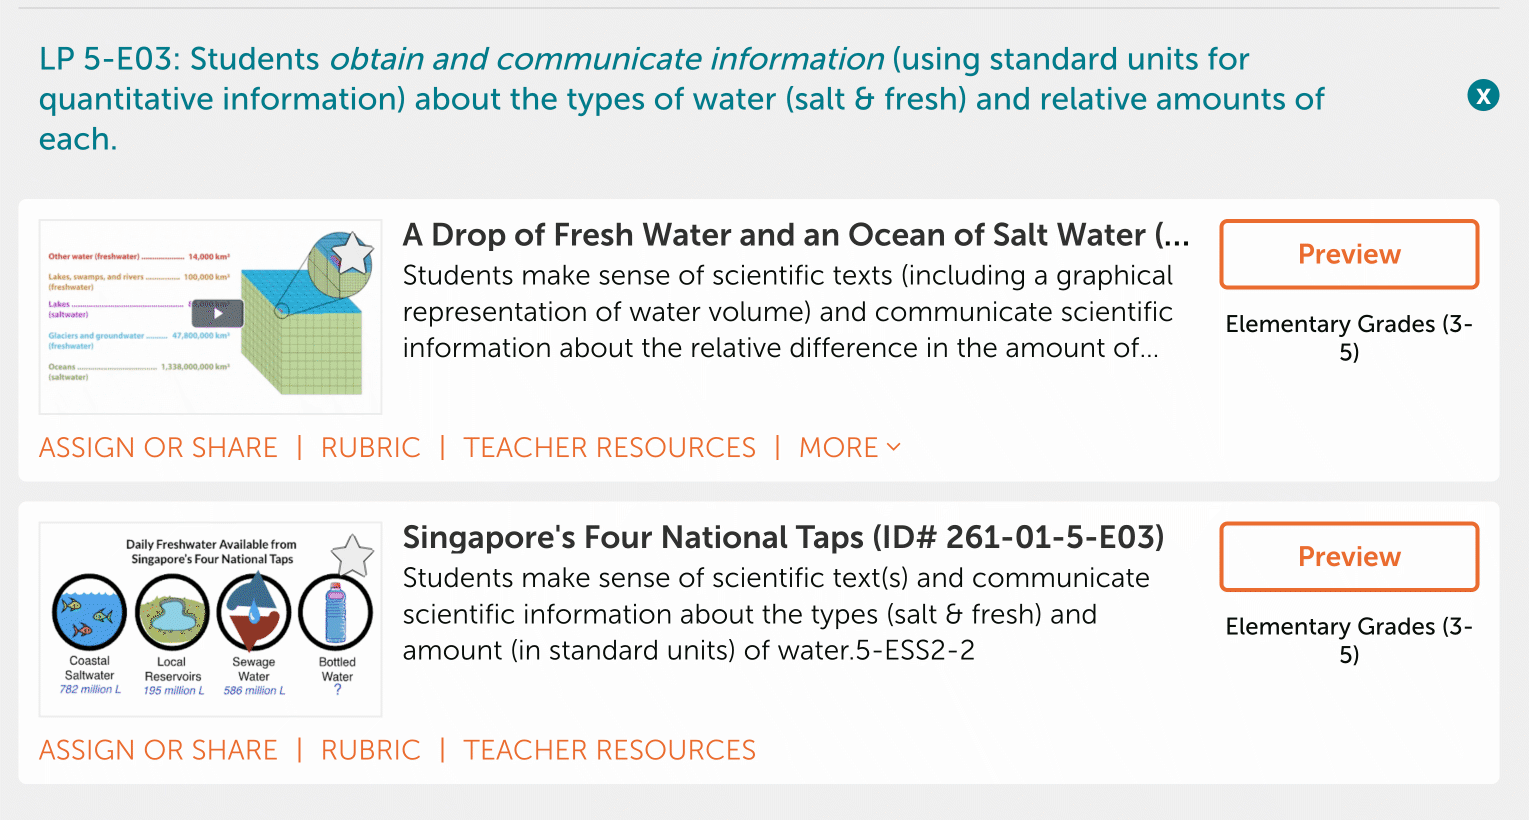
LP 5-E03: Students obtain and communicate information (using standard units for quantitative information) about the types of water (salt & fresh) and relative amounts of each. |
SEP: Obtaining, Evaluating, and Communicating Information |
|
|
DCI: Types of water (salt and fresh) and corresponding volumes |
||
|
CCC: Scale, Proportion, and Quantity |
||
|
KSA1: Ability to make sense of scientific text(s) and communicate scientific information about types of water (i.e., salt & fresh) |
ES1: Students obtain and communicate information from scientific text(s) to indicate that water is of two types: freshwater and saltwater |
|
|
KSA2: Ability to make sense of scientific text(s) and communicate quantitative information (in standard units) about the amounts of different types of water (i.e., salt & fresh) |
ES2: Students obtain and communicate information from scientific text(s) about the amount (in standard units) of saltwater and freshwater in a given locale/region (up to, and including, planet Earth as the locale/region) |
|
Note. This table documents the three learning performances (LP) and their associated focal knowledge, skills, and abilities (KSA), evidence statements (ES), and NGSS dimensions: Science and engineering practices (SEP), disciplinary core idea (DCI) "chunks", and crosscutting concepts (CCC).
References
Aldon, G., Cusi, A., Morselli, F., Panero, M., & Sabena, C. (2017). Formative assessment and technology: Reflections developed through the collaboration between teachers and researchers. In G. Aldon, F. Hitt, L. Bazzini, & U. Gellert (Eds.), Mathematics and technology (pp. 551-578). Springer. https://doi.org/10.1007/978-3-319-51380-5_25
American Educational Research Association, American Psychological Association, & National Council on Measurement in Education. (2014). Standards for educational and psychological testing. American Educational Research Association.
Behrens, J. T., DiCerbo, K. E., & Foltz, P. W. (2019). Assessment of complex performances in digital environments. The Annals of the American Academy of Political and Social Science, 683(1), 217-232. https://doi.org/10.1177/0002716219846850
Bennett, R. E. (2011). Formative assessment: A critical review. Assessment in Education: Principles, Policy & Practice, 18(1), 5-25. https://doi.org/10.1080/0969594X.2010.513678
Bennett, R. E. (2015). The changing nature of educational assessment. Review of Research in Education, 39(1), 370–407. https://doi.org/10.3102/0091732X14554179
Black, P., & Wiliam, D. (2009). Developing the theory of formative assessment. Educational Assessment, Evaluation and Accountability, 21(1), 5–31. https://doi.org/10.1007/s11092-008-9068-5.
Broadfoot, P., Daugherty, R., Gardner, J., Gipps, C., Harlen, W., James, M., & Stobart, G. (1999). Assessment for learning: Beyond the black box. University of Cambridge School of Education. https://doi.org/10.13140/2.1.2840.1444
Douglas, K., A., Gane, B. D., Neumann, K., & Pellegrino, J. W., (2020). Contemporary methods of assessing integrated STEM competencies. In C. C. Johnson, M. Mohr-Schroeder, T. Moore, L. Bryan, & L. English (Eds.) Handbook of research on STEM education (pp. 234–254). Routledge. https://doi.org/10.4324/9780429021381
Fine, C. & Furtak, E. M. (2020). A framework for science classroom assessment task design for emergent bilingual learners. Science Education, 104(3), 393-420. https://doi.org/10.1002/sce.21565
Finzer, W. & Damelin, D. (2016, April 8-12). Design perspective on the Common Online Data Analysis Platform.[Conference presentation]. Annual Meeting of the American Educational Research Association, Washington, D.C.
Fjørtoft, H. (2020). Multimodal digital classroom assessments. Computers & Education, 152, Article 103892. https://doi.org/10.1016/j.compedu.2020.103892
Furtak, E. M., Ruiz-Primo, M. A., Shemwell, J. T., Ayala, C. C., Brandon, P. R., Shavelson, R. J., & Yin, Y. (2008). On the fidelity of implementing embedded formative assessments and its relation to student learning. Applied Measurement in Education, 21(4), 360-389. https://doi.org/10.1080/08957340802347852
Gane, B. D., Zaidi, S. Z., & Pellegrino, J. W. (2018). Measuring what matters: Using technology to assess multidimensional learning. European Journal of Education, 53(2), 176–187. https://doi.org/10.1111/ejed.12269
German, S. (2019). Three-dimensional classroom assessment tasks. Science Scope, 42(7), 28-33. https://www.jstor.org/stable/26898941
Harris, C. J., Krajcik, J., Pellegrino, J. W., & DeBarger, A. H. (2019). Designing knowledge-in-use assessments to promote deeper learning. Educational Measurement: Issues and Practice, 38(2), 53-67. https://doi.org/10.1111/emip.12253
Heritage, M. (2010). Formative assessment and next-Generation assessment systems: Are we losing an opportunity?. Council of Chief State School Officers.
Mayer, R. E. (2020). Multimedia Learning (3rd ed.). Cambridge University Press. https://doi.org/10.1017/9781316941355
Mislevy, R. J., & Haertel, G. D. (2006). Implications of evidence-centered design for educational testing. Educational Measurement: Issues and Practice, 25(4), 6-20. http://doi.org/10.1111/j.1745-3992.2006.00075.x
Mislevy, R. J., Steinberg, L. S., & Almond, R. G. (2003). On the structure of educational assessments. Measurement: Interdisciplinary Research & Perspectives, 1(1), 3–62. https://doi.org/10.1207/S15366359MEA0101_02
Messick, S. (1989). Validity. In R. L. Linn (Ed.) Educational measurement (3rd Ed., pp. 13-103). Macmillan Publishing Company.
National Academies of Sciences, Engineering, and Medicine. (2018). How people learn II: Learners, contexts, and cultures. The National Academies Press. https://doi.org/10.17226/24783.
National Research Council. (2000). How people learn: Brain, mind, experience, and school: Expanded edition. The National Academies Press. https://doi.org/10.17226/9853
National Research Council. (2005). How students learn: History, mathematics, and science in the classroom. The National Academies Press. https://www.nap.edu/10126
National Research Council. (2012). A Framework for K-12 science education: Practices, crosscutting concepts, and core ideas. The National Academies Press. https://doi.org/10.17226/13165
National Research Council. (2014). Developing assessments for the Next Generation Science Standards. The National Academies Press. https://www.nap.edu/18409
NGSS Lead States. (2013). Next Generation Science Standards: For states, by states. The National Academies Press.
Norman, D. (1988). The design of everyday things. Doubleday.
Pead, D. (2012). World class tests: Summative assessment of problem-solving using technology. Educational Designer, 2(5). https://www.educationaldesigner.org/ed/volume2/issue5/article18/
Pellegrino, J. W., Chudowsky, N., & Glaser, R. (2001). Knowing what students know: The science and design of educational assessment. The National Academies Press. https://doi.org/10.17226/10019
Pellegrino, J. W., DiBello, L. V., & Brophy, S. P. (2014). The science and design of assessment in engineering education. In A. Johri & B. Olds (Eds.) Cambridge handbook of engineering education research (pp. 571-598). Cambridge University Press. https://doi.org/10.1017/CBO9781139013451.036
Pellegrino, J. W. (2020). Important considerations for assessment to function in the service of education. Educational Measurement: Issues and Practice, 39(3), 81–85. https://doi.org/10.1111/emip.12372
Pellegrino, J. W., DiBello, L. V., & Goldman, S. R. (2016). A framework for conceptualizing and evaluating the validity of instructionally relevant assessments. Educational Psychologist, 51(1), 59–81. https://doi.org/10.1080/00461520.2016.1145550
Pellegrino, J. W., & Hilton, M. L. (Eds.). (2012). Education for life and work: Developing transferable knowledge and skills in the 21st century. The National Academies Press. https://doi.org/10.17226/13398
Penuel, W. R., Van Horne, K., & Bell, P. (2020). Steps to designing a three dimensional assessment (Practice Brief 29). https://stemteachingtools.org/brief/29
Popham, W. J. (2008). Transformative assessment. Association for Supervision and Curriculum Development.
Ruiz-Primo, M. A., Shavelson, R. J., Hamilton, L., & Klein, S. (2002). On the evaluation of systemic science education reform: Searching for instructional sensitivity. Journal of Research in Science Teaching, 39(5), 369–393. https://doi.org/10.1002/tea.10027
Ryoo, K., & Linn, M. C. (2015). Designing and validating assessments of complex thinking in science. Theory into Practice, 54(3), 238-254. https://doi.org/10.1080/00405841.2015.1044374
Shavelson, R. J., Young, D. B., Ayala, C. C., Brandon, P. R., Furtak, E. M., Ruiz-Primo, M. A., Tomita, M. K., & Yin, Y. (2008). On the impact of curriculum-embedded formative assessment on learning: A collaboration between curriculum and assessment developers. Applied Measurement in Education, 21(4), 295-314. https://doi.org/10.1080/08957340802347647
Shepard, L. A. (2008). Commentary on the national mathematics advisory panel recommendations on assessment. Educational Researcher, 37(9), 602–609. https://doi.org/10.3102/0013189X08328001
Shute, V. J., & Rahimi, S. (2017). Review of computer‐based assessment for learning in elementary and secondary education. Journal of Computer Assisted Learning, 33(1), 1-19. https://doi.org/:10.1111/jcal.12172
Sweller, J. (1994). Cognitive load theory, learning difficulty, and instructional design. Learning and Instruction, 4(4), 295-312. https://doi.org/10.1016/0959-4752(94)90003-5
Sweller, J., van Merrienboer, J.J.G. & Paas, F.G.W.C. (1998). Cognitive architecture and instructional design. Educational Psychology Review, 10(3), 251–296. https://doi.org/10.1023/A:1022193728205
Wiliam, D. (2011). What is assessment for learning? Studies in Educational Evaluation, 37(1), 3–14. https://doi.org/10.1016/j.stueduc.2011.03.001
Wiliam, D. (2013). Assessment: The bridge between teaching and learning. Voices from the Middle, 21(2), 15.
Wilson, M. (2018). Making measurement important for education: The crucial role of classroom assessment. Educational Measurement: Issues and Practice, 37(1), 5-20. https://doi.org/10.1111/emip.12188
Acknowledgements
This work was produced under the auspices of a National Science Foundation DRK12 collaborative research award to the University of Illinois at Chicago (Award #1813737; Principal Investigator James Pellegrino) and the University of Chicago (Award #1813938; Principal Investigator Carla Strickland). We would like to acknowledge the contribution of Steve Roderick in assisting with reviewing and implementing the technology-enhanced versions of the assessment tasks. Carla Strickland, Elizabeth Lehman, Jeanne Di Domenico, and Debbie Leslie provided vital support to partner teachers as they participated in our professional learning community. Participating teachers were critical partners in this work, providing suggestions for task revisions and trying out the assessment tasks in their classrooms.
About the Authors

Brian Gane (bgane@ku.edu) is a Research Project Director at Accessible Teaching, Learning, and Assessment Systems (ATLAS) at the University of Kansas. His research focuses on the design, development, and use of educational resources and materials, especially with technology in formal learning environments. He works primarily in STEM fields, in general and special education settings, and with in-service teachers around using assessment to advance student learning.

Diksha Gaur (dgaur2@uic.edu) is a doctoral candidate at the Learning Sciences Research Institute at the University of Illinois Chicago. Her research is focused on formative use of standards aligned science assessment tasks and resources. More specifically, she studies how students engage with specific science practices when using assessment tasks as learning resources by working on them in collaborative groups. As a learning scientist, Diksha is firmly grounded in the belief that learning is a sociocultural activity and collaboratively engaging in classroom-based assessments designed for formative use can be an important means of enculturating students in authentic disciplinary practices.

Samuel Arnold (sarnol4@uic.edu) is a doctoral student at the Learning Sciences Research Institute at the University of Illinois Chicago. His work draws upon education, learning sciences, and computer science to inform the design of educational materials. Currently, his research explores how people develop varying levels of data literacies in response to contextual demands, and the implications of these variations on the design of educational tools.

Daniel Damelin (ddamelin@concord.org) has worked in the field of education for 30 years, as a teacher, curriculum and technology developer, professional development leader, and educational researcher. Currently a Senior Scientist at the non-profit Concord Consortium, he has worked on numerous grant funded projects that resulted in open educational resources to support the learning of science through simulation and data visualization, inquiry-oriented curriculum and pedagogy, and formative assessment.